
Table of Contents
- Why Airflow Visualization Studies Fail: The Core Causes
- Common Mistakes in Smoke Studies and How to Avoid Them
- Airflow Visualization Equipment for Cleanrooms: Choosing What Works
- Mastering Cleanroom Smoke Study Best Practices for Reliable Results
- Troubleshooting Poor Visibility: Lighting, Contrast, and Reflection
- Equipment Interference: Is Your Hardware Distorting the Airflow Pattern?
- Navigating ISO 14644 Airflow Visualization Requirements
- Digital Documentation and Software Validation for Your Smoke Study
- Post-Failure Remediation: Steps to Correct a Failed Study
- Conclusion: Building a Repeatable Airflow Visualization Protocol
- Frequently Asked Questions
Last Updated: September 9, 2026
Cleanroom airflow visualization is the practice of using visible fog or tracer gas to confirm that air moves in the intended pattern, protecting critical products from contamination. When these studies fail, the usual suspects are poor lighting, equipment interference, or operator technique, not the cleanroom itself. Applied Physics has supported critical manufacturing environments since 1992, providing the cleanroom foggers, calibration standards, and monitoring systems that make defensible airflow studies possible. Below, we will walk through the most common failures and, more importantly, how to correct them so your next smoke study passes on the first attempt.
Why Airflow Visualization Studies Fail: The Core Causes
Most failed airflow visualization studies trace back to three root causes: inadequate lighting, physical interference from equipment, and improper fog generation technique. These issues account for the vast majority of re-qualification cycles, yet each is preventable with the right preparation.
The fundamental problem is that operators often treat the smoke study as a passive observation rather than an active diagnostic. You are not just watching fog move; you are interrogating the airflow pattern for weaknesses. A common mistake is assuming that if the HEPA filters are certified, the airflow must be correct. In practice, obstructions, air balance issues, and even the presence of the operator can distort the unidirectional airflow you are trying to verify.
Understanding this distinction matters because the corrective action differs. A lighting problem requires repositioning lamps, while an equipment interference issue requires relocating hardware or changing the fog release point. Misdiagnosing the cause leads to wasted hours and repeated failures.
Common Mistakes in Smoke Studies and How to Avoid Them
Several recurring mistakes plague cleanroom smoke studies, and recognizing them early saves significant downtime. The most frequent error is releasing fog too close to the supply air diffuser, which creates turbulent mixing that obscures the true laminar flow pattern.
Other common mistakes include:
- Using a fog generator that produces droplets too large, which fall out of the airflow and give false readings
- Failing to establish a dark or neutral background for adequate contrast
- Ignoring the impact of the operator’s own body heat and movement on the airflow pattern
- Running the study before the room has reached thermal equilibrium
Each of these mistakes produces a distorted airflow pattern that fails to represent actual conditions. The remedy is to standardize your approach: position the fog source at the critical work zone, wait for stable room conditions, and use a consistent release velocity. Cleanroom smoke study best practices demand that you document the room state, including temperature and air exchange rate, before drawing any conclusions about the results.
Airflow Visualization Equipment for Cleanrooms: Choosing What Works
Selecting the right airflow visualization equipment for cleanrooms is the difference between a clear, defensible study and an ambiguous one. The two primary options are ultrapure liquid nitrogen foggers and ultrasonic foggers, each suited to different applications.
LN2 foggers produce a dense, cold fog that is ideal for large spaces and high airflow volumes. They generate fog by condensing moisture in the air around a liquid nitrogen stream, creating particles that closely follow the airflow. Ultrasonic foggers, by contrast, use high-frequency vibration to create a fine mist from distilled water, offering more control for smaller, tighter spaces like glove boxes or isolators.
Consider what you are validating. For a large aseptic filling line, an LN2 fogger with a remote control for adjusting fog volume and velocity offers the reach you need. For a compounding pharmacy hood, a portable ultrasonic unit provides the precision required without overwhelming the space. Applied Physics offers both LN2 ultrapure and ultrasonic cleanroom foggers, and the choice depends on your room size, airflow velocity, and the sensitivity of your process.
Mastering Cleanroom Smoke Study Best Practices for Reliable Results
Reliable smoke studies depend on a repeatable protocol that controls every variable you can influence. Before you generate a single puff of fog, confirm that the room is in its normal operating state, with all HVAC systems running at the specified air exchange rate and the room at thermal equilibrium.
The release technique matters as much as the equipment. Introduce the fog at a low velocity, parallel to the expected airflow direction, and observe from a position that does not disturb the pattern. Move slowly, and avoid walking between the light source and the fog stream, as your body will create eddies that confuse the picture.
Document everything: the fog generator settings, the release point, the lighting configuration, and the observed airflow pattern. This documentation is not just bureaucratic overhead; it is the evidence your auditors will review. A well-executed study with clear video documentation demonstrates that your facility understands its airflow and can defend its contamination control strategy. Consistency in your approach also makes it easier to spot subtle changes in performance over time.
Troubleshooting Poor Visibility: Lighting, Contrast, and Reflection
When you cannot see the fog, you cannot validate the airflow, making lighting the most common culprit in failed studies. The fog particles are only visible when light reflects off them against a contrasting background, so your lighting setup determines your success.
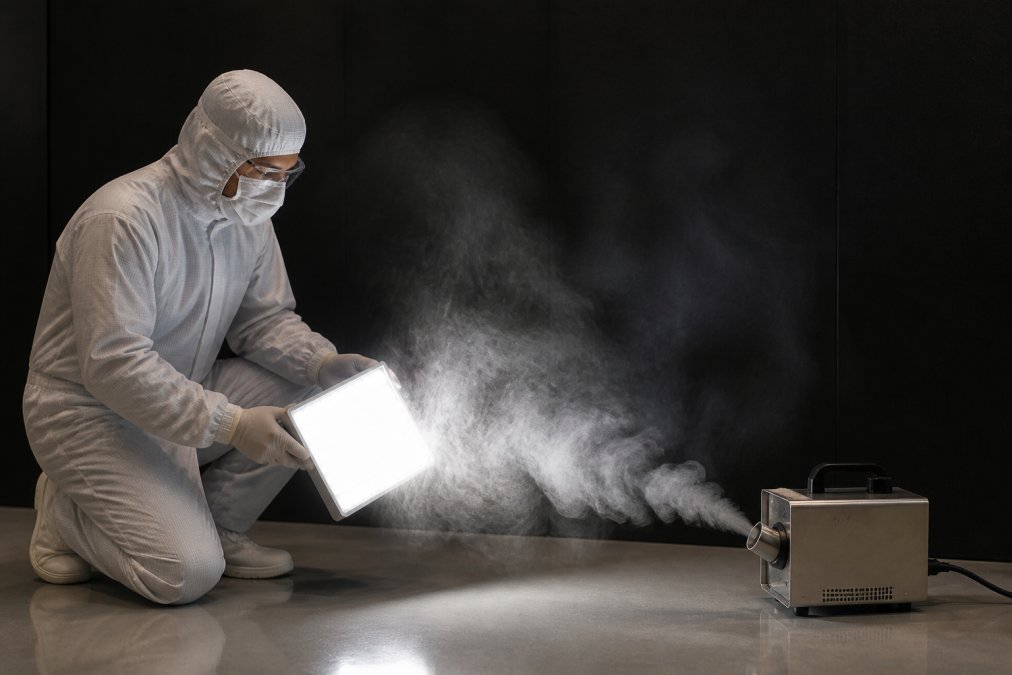
Use a high-intensity light source positioned at a low angle, shining across the fog stream rather than directly at it. A dark, matte background behind the fog improves contrast dramatically. Glare and reflection from stainless steel surfaces or glass can obscure the pattern, so adjust the light angle to minimize specular highlights.
If visibility remains poor, check the fog density. Too little fog and the stream disappears; too much and it becomes opaque, hiding the subtle flow patterns you need to see. Adjust the fog output in small increments until you achieve a clear, visible stream that still allows you to see individual eddies and flow lines. This tuning process is iterative, but it is the difference between a useful study and a wasted hour.
Equipment Interference: Is Your Hardware Distorting the Airflow Pattern?
Equipment interference is often the most difficult failure to diagnose because the problem is not the equipment itself, it is the interaction between the equipment’s physical geometry and the cleanroom’s airflow velocity. A large, flat surface like a stainless steel table can act as a bluff body, creating a downstream recirculation zone that extends several times the object’s height. In a unidirectional airflow room operating at 90 feet per minute (fpm), this recirculation zone can pull contaminated air back toward the critical work zone, completely negating the protective effect of the clean air supply (ispe.org).
The first step in troubleshooting is to understand the specific aerodynamic mechanisms at play. There are three primary types of interference:
- Wake Effects: When air flows over a solid object, it creates a low-pressure wake downstream. For a typical filling machine or a cart, this wake can extend 2 to 3 times the object’s height downstream. If your critical work zone is within this wake, you will see turbulent, recirculating smoke instead of clean, parallel flow lines.
- Boundary Layer Separation: Air moving along a flat surface will separate at sharp edges, creating vortices. This is common on the leading edge of stainless steel tables or the top of equipment enclosures. These vortices can entrain particles and hold them in the airflow path.
- Thermal Plumes: Equipment that generates heat, such as motors, pumps, or even a laptop used for data collection, creates a thermal plume that rises against the downward airflow. If the plume’s upward velocity exceeds the room’s downward airflow velocity, it will disrupt the unidirectional flow and create a localized area of turbulence. A piece of equipment generating even 100 watts of heat can produce a plume that rises at 30-50 fpm, which can be significant in a room designed for 90 fpm airflow.
To diagnose which mechanism is affecting your study, use a staged approach. First, run the visualization study with the equipment in place but powered off. This isolates thermal effects from physical obstruction. If the airflow pattern is clean with the equipment off but turbulent with it on, you have a thermal plume problem. The fix is not to move the equipment but to increase the local exhaust or redirect the supply air to overcome the plume.
If the pattern is turbulent in both cases, the issue is physical obstruction. The most effective remediation is not always to move the equipment, which may be impossible in a production line, but to modify the airflow path. Consider these specific interventions:
- Install perforated panels on the upstream side of the equipment to smooth the airflow and reduce the wake effect. A panel with 40-50% open area can significantly reduce downstream turbulence.
- Raise the equipment off the floor to allow airflow to pass underneath, reducing the effective cross-sectional area of the obstruction.
- Relocate the fog release point to a position that is upstream of the equipment and at the height of the critical work zone. This allows you to see whether the airflow is already turbulent before it reaches the equipment or if the equipment is the cause.
A practical diagnostic technique is to use a support rod and arm extender to position the fog delivery wand at multiple heights and distances around the equipment. By systematically mapping the airflow pattern in three dimensions, you can identify the exact boundary of the recirculation zone and determine whether your critical work zone falls within it. This is far more effective than a single release point, which only shows you one slice of the airflow picture.
A unique angle to consider is the concept of post-remediation verification. Once you have identified the interference and made a change, whether it is moving equipment, adding a panel, or adjusting airflow, you cannot simply re-run the same study and call it done. You must verify that the fix did not create a new problem elsewhere. For example, adding a perforated panel might smooth airflow downstream of the equipment but could create a dead zone behind the panel itself. After any remediation, you should run a full airflow mapping study, not just a single-point visualization, to confirm that the entire critical zone is protected.
Finally, document the interference and your remediation in your deviation log. This is not just for auditors; it is a valuable reference for future studies. If you see a similar pattern in a different room, you will have a record of what worked and what did not. This transforms troubleshooting from a reactive, time-consuming process into a proactive, knowledge-based activity that reduces downtime and strengthens your overall contamination control program.
Navigating ISO 14644 Airflow Visualization Requirements
Regulatory compliance for airflow visualization is not a single checkbox; it is a layered process that requires you to align your study protocol with specific clauses of the ISO 14644 standard and the expectations of your auditing body. The most common failure is treating the study as a pass/fail test rather than a documented, evidence-generating procedure. To move beyond a superficial understanding, you need to know which parts of the standard apply and how to build a defensible record.
The primary reference is ISO 14644-3, which outlines the test methods for cleanroom classification and performance. For airflow visualization, the standard describes a test to confirm the airflow pattern is consistent with the design intent, whether that is unidirectional, turbulent, or mixed. The key requirement is that the visualization must demonstrate that the airflow effectively sweeps contaminants away from the critical work zone (the point of product or process exposure). The acceptance criteria are not a single number but a qualitative observation: the smoke stream must remain parallel and uniform for unidirectional flow, or show complete mixing and no stagnant zones for turbulent flow.
However, the standard does not exist in a vacuum. Your protocol must also align with the operational requirements of ISO 14644-2, which specifies the monitoring plan for ongoing cleanliness. This means your airflow visualization study is not just a one-time qualification event; it is part of a periodic re-qualification cycle. The standard requires you to define the interval between tests based on risk, and your documentation must show that you have a rationale for that interval.
A common gap in understanding is the lack of detail on how to document the study for an audit. Your record must go beyond a simple video clip. For each study, your documentation package should include:
- A pre-study checklist confirming room conditions (temperature, humidity, differential pressure) are within the specified operational ranges.
- A detailed test method referencing the specific ISO 14644-3 clause you are following and a description of your fog generation and release technique.
- A visual record with a clear, readable timestamp and a label identifying the room, the study objective, and the operator. This is your primary evidence.
- An interpretation report that states the observed airflow pattern and explicitly concludes whether it meets the acceptance criteria for your facility’s classification.
- A deviation log if the study fails, documenting the root cause analysis and the corrective action taken.
A common audit finding is that facilities have video footage but no written interpretation of what the footage shows. A video without a signed, dated conclusion is not evidence; it is just a file. Ensure your report explicitly states that the airflow pattern was ‘consistent with unidirectional flow’ or ‘showed no evidence of stagnant zones’ to provide a clear, auditable conclusion.
Beyond the ISO standard, you must be aware of how regulatory bodies interpret these requirements. The FDA’s guidance on aseptic processing (which you can find via FDA Guidance for Industry: Sterile Drug Products Produced by Aseptic Processing) explicitly states that airflow patterns should be visualized to demonstrate the absence of turbulence and stagnant air. This is not a suggestion; it is an expectation during inspections. The guidance emphasizes that the study should be performed at the critical work zone and that the visualization should be recorded. Your protocol should be written to satisfy both the ISO standard’s methodology and the FDA’s expectation for evidence of contamination control.
Finally, consider the role of your cleanroom monitoring system in this process. While the visualization study is a point-in-time test, your ongoing monitoring data provides the context that makes the study meaningful. If your monitoring system shows a gradual shift in air velocity or particle counts, that data can inform when you need to re-run your visualization study before a scheduled re-qualification. This integration of continuous data with periodic testing is a best practice that demonstrates a mature, proactive contamination control program, rather than a reactive one that only acts after a failure.
By treating ISO 14644 not as a single standard but as a framework that interacts with your operational procedures and regulatory expectations, you transform your airflow visualization study from a compliance exercise into a powerful diagnostic tool that protects your product and your facility’s reputation.
Digital Documentation and Software Validation for Your Smoke Study
Digital documentation, including high-resolution video, provides indisputable evidence of the airflow pattern at a specific moment in time, and it allows reviewers to examine the study in detail. Digital documentation, including high-resolution video, provides indisputable evidence of the airflow pattern at a specific moment in time, and it allows reviewers to examine the study in detail.
When capturing video, use a consistent camera position and angle, and record the entire study without interruption. Include a visible timestamp and a label identifying the room, the date, and the study purpose. This creates a chain of evidence that auditors can follow.
Software validation is the often-overlooked component. If you use software to analyze airflow patterns or to generate reports, that software must be validated to ensure it produces accurate, reliable results. This means documenting the software’s intended use, testing its functionality, and maintaining records of any changes or updates. The FDA guidance on software validation outlines expectations for computerized systems used in regulated environments, and applying these principles to your documentation process strengthens your compliance posture.
A cleanroom monitoring system with data logging capabilities can support this effort by providing continuous, automated records of room conditions during the study, complementing your video evidence with hard data on air velocity, temperature, and particle counts.
Post-Failure Remediation: Steps to Correct a Failed Study
A failed smoke study is not a dead end; it is a diagnostic signal that something in your environment needs correction. The first step is to isolate the cause by reviewing your documentation, checking the room conditions, and identifying any changes since the last successful study.
Work through these steps systematically:
- Review the video footage to identify where the airflow pattern broke down.
- Check the air balance and verify that supply and return air volumes match the design specifications.
- Inspect HEPA filters for damage or bypass leaks that could disrupt airflow.
- Confirm that no equipment was moved or added since the last successful study.
- Re-run the study with adjusted lighting or fog output to rule out observation errors.
Once you identify the root cause, implement the corrective action and re-run the study. This may take several iterations, but each attempt provides more data. Document every step of the remediation process, including the corrective action taken and the final result. This record demonstrates to auditors that you have a systematic approach to maintaining cleanroom performance, and it builds a history that makes future troubleshooting faster.
Conclusion: Building a Repeatable Airflow Visualization Protocol
The goal of airflow visualization is not a single successful study; it is a repeatable protocol that consistently demonstrates your cleanroom is performing as designed. By addressing the common failure modes, standardizing your equipment and technique, and documenting your results rigorously, you build a qualification program that stands up to scrutiny.
A repeatable protocol starts with the right equipment, maintained and calibrated properly, and a team that understands the principles of airflow and contamination control. It continues with thorough documentation that captures not just the results, but the conditions and methods that produced them.
When your protocol is solid, a failed study becomes a rare event, and when it does occur, your documentation makes the cause obvious and the fix straightforward. That is the mark of a mature contamination control program.
Cleanroom airflow visualization does not have to be a source of recurring frustration. The failures you encounter are almost always traceable to correctable causes, and the path to reliable results is clear. Applied Physics has supported critical manufacturing environments since 1992, providing the cleanroom foggers, calibration standards, and monitoring systems that make defensible airflow studies possible. Contact our team to discuss how our equipment and expertise can strengthen your validation protocol and reduce the downtime associated with failed studies.
Frequently Asked Questions
What are the most common causes of failed cleanroom smoke studies?
Most failures trace back to four issues: inadequate lighting that makes the fog stream hard to see, equipment interference from the fogger or operator altering the airflow, incorrect fog output volume for the room size, and poor technique like holding the wand too close to the HEPA filter. Each creates misleading airflow patterns that don’t reflect true conditions. Addressing these before the study begins prevents most failures.
What equipment is best for cleanroom airflow visualization?
The right airflow visualization equipment for cleanrooms depends on your ISO class and study goals. Ultrasonic foggers produce a cold, dense fog ideal for most pharmaceutical and semiconductor applications, while LN2 ultrapure foggers suit environments where particle neutrality is critical. Look for units with adjustable flow control and wireless operation so you can position the fog source without an operator standing in the airflow path.
How often should airflow visualization studies be performed per ISO 14644?
ISO 14644 does not mandate a specific frequency for airflow visualization, but GMP guidelines and industry practice recommend performing smoke studies at least annually or whenever you make changes to HVAC configuration, install new equipment, or alter room layout. Many facilities also run visualization studies during initial qualification, after filter certification, and following any remediation work that affects air balance.
Why does my fog dissipate before reaching the critical work zone?
Fog dissipating prematurely usually means your fog output is too low for the air volume or the air velocity in the room is higher than expected. High air exchange rates can dilute the fog before it travels the full distance. Try increasing the fog volume, using a fogger with adjustable velocity, and positioning the output closer to the supply air source to trace the complete airflow path.
