Applied Physics · Precision technologies since 1992
Request Quote
ÅP Cleanroom

Cleanroom Contamination Control & Airflow Validation

See how air actually moves, verify contamination-control behavior, and build defensible evidence for qualification, smoke studies, environmental monitoring, and process investigations.

Since 1992Applied Physics engineering heritage
CRF + APUltrasonic and LN₂ fogger families
ISO / USP / GMPValidation-workflow context
Air + ParticlesVisualization and monitoring ecosystem
Validation pathways

One cleanroom program. Four complementary evidence streams.

Airflow visualization tells you where contamination can travel. Particle and microbial monitoring tell you what is present. Together, they support qualification, investigation and ongoing contamination-control programs.

01

Airflow Visualization

Observe directional airflow, turbulence, recovery and contamination transport around critical zones.

  • Smoke studies
  • First-air visualization
  • Door and operator effects
Explore foggers
02

Particle Monitoring

Measure airborne particulate concentrations and verify cleanroom classification and process conditions.

  • Portable counters
  • Remote sensors
  • Continuous monitoring
Particle counters
03

Microbial Air Sampling

Collect viable airborne contamination data for environmental monitoring and controlled-area investigations.

  • Portable sampling
  • Remote sampling
  • High-pressure applications
Air samplers
04

Controlled Environments

Apply visualization and monitoring to RABS, isolators, BSCs, clean benches and other critical enclosures.

  • RABS / isolators
  • Biosafety cabinets
  • Laminar-flow work zones
Request application guidance
Why airflow validation matters

Particle counts alone cannot show where contamination travels.

Cleanrooms are engineered around filtration, pressure differentials and airflow direction, but the as-built design does not guarantee the same behavior during real operation. Personnel movement, equipment placement, door openings and process activity can change local airflow patterns.

Airflow visualization allows engineers to see how air moves around equipment, operators and critical surfaces. Typical studies evaluate laminar-flow behavior, turbulence, shadowing, recovery after disturbances and potential contamination transport pathways.

Verify airflow direction at critical surfaces
Observe operator and equipment interference
Document smoke-study behavior on video
Investigate unexpected contamination pathways
Support requalification after process changes
Standards & regulated workflows

Designed for the validation work your quality team already performs.

Applied Physics equipment supports airflow-visualization and contamination-monitoring workflows used under common cleanroom and aseptic-processing frameworks. The equipment supports the validation activity; compliance remains facility- and protocol-specific.

ISO

ISO 14644

Use airflow visualization during qualification and requalification to demonstrate directional behavior and contamination removal.

  • Installation qualification
  • Operational qualification
  • Periodic requalification
USP

USP <797> / <800>

Visualize first-air protection, compounding-zone airflow, barrier behavior and operator interaction under applicable pharmacy protocols.

  • Primary engineering controls
  • Dynamic studies
  • Operator-present conditions
GMP

Aseptic Manufacturing

Document airflow protection around filling, packaging and sterile-processing operations under facility-specific validation procedures.

  • Critical zones
  • Interventions
  • Recorded evidence
Fog-generation technologies

Choose the fogger family around the study—not the other way around.

Applied Physics manufactures both ultrasonic CRF systems and LN₂ AP systems for different airflow-visualization requirements.

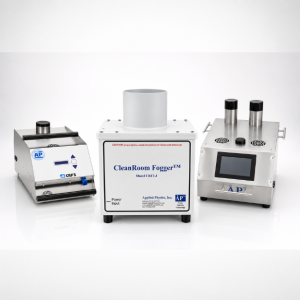
CRF Series · Ultrasonic

Portable DI/WFI/sterile-water fog generation for localized airflow visualization, clean benches, door studies, enclosures and room balancing.

CRF6: 48 ultrasonic piezos, dual 80 mm outlets and approximately 2.4 m³/min fog volume.

Explore CRF Series

AP Series · LN₂

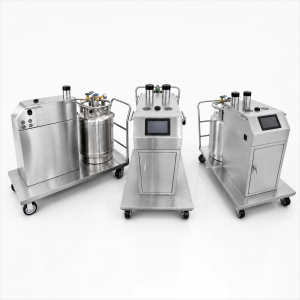
High-visibility LN₂ fogging for larger spaces, long visualization paths and studies where dense, fast-dissipating fog is preferred.

Dewar-style family: AP35, AP95 and AP175 correspond to nominal 35 L, 95 L and 175 L Dewar capacities.

Explore AP Series
Environmental verification

Visualization is one part of the contamination-control picture.

A

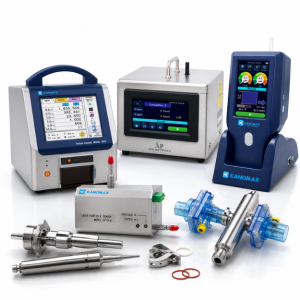
Particle Counters

Measure airborne particle concentration for certification, process monitoring and investigations.

  • Handheld
  • Portable
  • Remote
Browse particle counters
B

Microbial Air Samplers

Support viable environmental monitoring with portable and remote sampling configurations.

  • P100 / P100ss
  • Remote sampling
  • Compressed gas options
Browse air samplers
C

Air & Environment

Extend monitoring with indoor-air-quality, dust and application-specific contamination tools.

  • Trend monitoring
  • Investigation support
  • Facility verification
Operational consequence

Poor airflow can stay invisible until it becomes an expensive quality event.

Sterile-product contamination
Batch rejection or investigation
Semiconductor particle defects
Failed environmental investigations
Regulatory observations
Requalification downtime
Applications & users

Built for teams that have to prove what the environment is doing.

Where

Typical environments

Applied Physics cleanroom systems support qualification and investigation work across controlled environments.

  • Pharmaceutical manufacturing
  • Sterile compounding
  • Biotechnology laboratories
  • Semiconductor fabs
  • Medical-device manufacturing
  • Hospital sterile environments
Who

Typical users

Results are commonly generated and reviewed by technical and quality teams responsible for controlled environments.

  • Validation engineers
  • Cleanroom certifiers
  • Quality assurance
  • Facility engineering
  • Microbiology teams
  • Regulatory/compliance specialists
FAQ

Cleanroom airflow validation questions.

What is a cleanroom smoke study?

A smoke study visualizes airflow patterns in a controlled environment so the team can verify airflow direction and observe potential contamination transport around critical surfaces.

Why is airflow visualization needed if particle counts are acceptable?

Particle counters measure concentration, but they do not reveal airflow direction, turbulence, shadowing or the path contaminants may take through a critical zone.

Ultrasonic or LN₂ fogger?

Ultrasonic systems are well suited to portable and localized studies; LN₂ systems are typically selected when higher fog volume, longer visualization paths or larger spaces are involved.

When are airflow studies performed?

Common triggers include initial qualification, periodic requalification, equipment relocation, process changes, investigations and protocol-specific dynamic studies.

Do Applied Physics foggers make a cleanroom compliant?

No single instrument makes a facility compliant. The equipment supports the documented testing and validation workflow defined by the facility, protocol and applicable standard.

Tell us what you need to visualize.

Share the room or enclosure type, approximate size, protocol context and required study date. We can help match the application to the appropriate fogger and accessories.

Request a Quote
You were not leaving your cart just like that, right?

You were not leaving your cart just like that, right?

Enter your details below to save your shopping cart for later. And, who knows, maybe we will even send you a sweet discount code :)

Want to receive personalized offers?

Allow notifications to get real-time updates about your shopping cart and who knows, you may even receive a sweet discount code 😊
Maybe later