
Table of Contents
- What Are Airflow Dead Zones and Why They Matter
- Common Causes of Dead Zones in Cleanroom Environments
- Step 1: Perform an Airflow Visualization Test
- Step 2: Conduct ISO 14644-3 Airflow Testing Procedures
- Step 3: Map Velocity Profiles and Identify Stagnant Zones
- Understanding Cleanroom Fogger Applications for Testing
- Step 4: Rebalance Your HVAC System
- Documentation and Compliance Validation
- Frequently Asked Questions
Last Updated: August 24, 2026
What Are Airflow Dead Zones and Why They Matter
Airflow dead zones are areas within a cleanroom where air circulation stagnates or moves too slowly to maintain required contamination control. These zones occur when laminar airflow patterns break down, allowing particulate matter and microbial contaminants to accumulate rather than being swept toward air returns.
When air velocity drops below the minimum required for your ISO classification, typically 0.3 to 0.5 meters per second for ISO Class 5 through 7 environments, particles no longer flow predictably toward exhaust points. Instead, they settle on work surfaces, equipment, and products. For pharmaceutical manufacturers operating under GMP guidelines, this contamination risk can invalidate batches and trigger regulatory action (the FDA).
Most facilities discover dead zones only during formal re-validation studies or after product failures force investigation. The difference between a facility that catches airflow problems early and one that doesn’t often comes down to having the right testing approach and executing it regularly.
Common Causes of Dead Zones in Cleanroom Environments
Dead zones form predictably around equipment placement, structural features, and HVAC design decisions. Identifying the root cause determines which corrective actions will work.
Equipment obstruction is the most common culprit. Benches, isolators, pass-throughs, and storage units disrupt laminar airflow patterns. When equipment sits directly in the path of downward or horizontal airflow, it creates a “shadow” behind it where air velocity drops significantly.
Poorly designed return air grilles allow stagnant pockets to form near walls and corners. If return air intake is concentrated in one location or positioned too high, air from distant zones takes longer to reach the return, allowing particles to settle during transit.
Inadequate air change rates compound the problem. If your HVAC system can’t deliver enough air changes per hour for your ISO classification and operational activity level, even well-designed zones will experience stagnation during peak operations.
Structural obstacles like columns, wall protrusions, and ceiling-mounted utilities create persistent dead zones. These require compensation through HVAC rebalancing or equipment repositioning rather than removal.
Temperature gradients can also trap air. When warm air rises and cool air sinks, convective currents override designed laminar flow patterns, especially problematic with high heat-generating equipment.
Step 1: Perform an Airflow Visualization Test
The first step in troubleshooting airflow dead zones is making the invisible visible. Airflow visualization tests reveal actual air movement patterns so you can identify where stagnation occurs.
Smoke testing remains the most practical visualization method for most cleanroom environments. Introduce smoke particles into the cleanroom and observe their movement. Areas where smoke disperses quickly indicate good airflow. Areas where smoke lingers, swirls, or accumulates show dead zones.
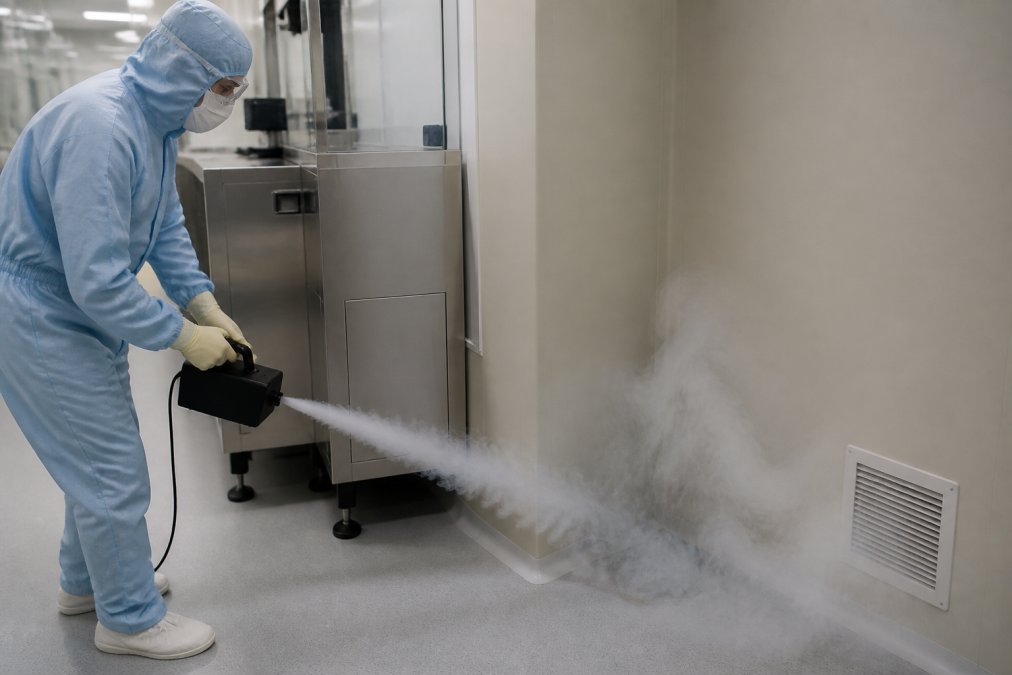
Conducting the smoke test:
- Prepare the cleanroom in operational mode with HVAC running and equipment powered on
- Introduce smoke from a handheld smoke generator at multiple locations: near the air supply, around equipment, and along walls
- Observe smoke behavior for 30-60 seconds at each location
- Document areas where smoke moves toward air returns (good flow) and areas where it stalls or circles (dead zones)
- Repeat testing at different heights to map the full airflow pattern
Precision cleanroom foggers produce consistent particle sizes and neutral buoyancy, meaning fog behavior reflects actual airflow patterns rather than being distorted by particle variations. Document observations photographically or on a cleanroom layout diagram, marking zones where smoke disperses rapidly versus where it stalls.
Step 2: Conduct ISO 14644-3 Airflow Testing Procedures
Smoke visualization is qualitative. For regulatory compliance and formal documentation, you need quantitative airflow velocity measurements that meet ISO 14644-3 standards.
ISO 14644-3 defines the methodology for measuring airflow patterns in cleanrooms, specifying grid spacing, measurement points, equipment requirements, and acceptance criteria. This ensures your data is defensible during regulatory audits and re-validation studies.
Measure airflow velocity at regular intervals across the cleanroom floor using calibrated anemometers. For most ISO Class 5-7 cleanrooms, establish a grid with measurement points spaced 1 meter apart. At each point, record velocity in meters per second.
ISO 14644-3 testing workflow:
- Establish a measurement grid covering the entire cleanroom floor
- Record ambient conditions (temperature, humidity, pressure differential)
- Measure velocity at each grid point using a calibrated anemometer
- Record direction of airflow (downward, horizontal, or mixed)
- Calculate average velocity and identify zones where velocity falls below minimum requirements
- Document all measurements on a velocity profile map
The standard defines minimum acceptable velocities for different ISO classifications. For ISO Class 5, laminar airflow should maintain 0.45 ± 0.2 m/s. For ISO Class 7, the range is 0.38 ± 0.2 m/s (iso.org). Any measurement falling below these ranges indicates a potential dead zone.
This quantitative data provides objective evidence of airflow performance for your quality system, establishes a baseline for comparison after HVAC adjustments, and creates a defensible record for regulatory review.
Step 3: Map Velocity Profiles and Identify Stagnant Zones
Velocity profile mapping transforms individual airflow measurements into a visual representation of your cleanroom’s airflow patterns, revealing where stagnation occurs and how severe the problem is.
A velocity profile map displays airflow velocity across your cleanroom floor using color coding or contour lines. Zones with adequate velocity appear in one color; zones with marginal velocity in another; zones with insufficient velocity in a third. The map immediately shows where dead zones exist and how they’re distributed.
Interpreting your velocity profile:
- Green zones (adequate velocity): Air moves at or above minimum required velocity, maintaining good contamination control
- Yellow zones (marginal velocity): Air moves at 80-100% of minimum required velocity, at risk during high-activity periods
- Red zones (insufficient velocity): Air velocity falls below minimum requirements, confirmed dead zones requiring corrective action
The pattern of your dead zones reveals their cause. Dead zones clustered near equipment indicate obstruction problems. Dead zones concentrated near walls suggest return air design issues. Dead zones distributed across the entire cleanroom might indicate insufficient air change rates.
Once identified, prioritize corrective actions. Focus first on red zones, which pose immediate contamination risk. Address yellow zones as part of your longer-term improvement plan.
Understanding Cleanroom Fogger Applications for Testing
Airflow dead zone troubleshooting relies on two fundamentally different testing approaches: physical visualization and measurement versus computational fluid dynamics (CFD) simulation. Understanding when to deploy each method is critical for efficient problem-solving and regulatory defensibility.
Physical Testing: Smoke Visualization and Velocity Profiling
Smoke testing and ISO 14644-3 velocity profiling are direct observation methods. These methods are immediate, require no modeling assumptions, and produce data that regulators expect in validation records.
Cleanroom foggers are specialized tools for physical visualization. A cleanroom fogger generates neutral-buoyancy fog particles that follow airflow patterns without distortion. Unlike smoke from matches or incense, which rises due to heat, precision fogger output remains suspended in air and moves with the airflow.
Two fogger technologies serve different applications:
Ultrasonic foggers use vibrating piezo elements to atomize liquid into fine particles. They’re ideal for routine airflow visualization and troubleshooting because they’re portable and easy to deploy.
LN₂ (liquid nitrogen) foggers produce fog by flash-evaporating cryogenic liquid. They generate denser fog that travels farther and persists longer, making them suitable for large cleanrooms or negative-pressure spaces. They’re preferred for formal validation studies because their fog characteristics are more consistent. The trade-off: they require cryogenic supply management and trained operators.
When conducting airflow visualization tests, introduce fog at multiple locations and observe its behavior. Fog should flow smoothly toward air returns. If fog stalls, swirls, or accumulates in specific areas, you’ve confirmed a dead zone. ductwork air loss.
Computational Fluid Dynamics: Simulation and Predictive Modeling
CFD is a numerical simulation method that models airflow behavior based on your cleanroom’s geometry, HVAC specifications, equipment placement, and operating conditions. Rather than measuring what is, CFD predicts what will be under different scenarios, making it powerful for design-phase planning and “what-if” analysis.
When to use CFD:
- Pre-construction planning: Predict whether your proposed HVAC design will eliminate dead zones before building
- Equipment layout optimization: Model different equipment arrangements to show which layout produces the best airflow uniformity
- HVAC redesign evaluation: Evaluate whether increasing supply air volume, relocating return grilles, or redesigning the plenum will solve the problem
- Negative-pressure room design: Particularly valuable for complex pressure-controlled spaces where physical testing is difficult
Limitations of CFD:
CFD is only as accurate as the model inputs. If your model doesn’t accurately represent actual equipment geometry, HVAC specifications, or operating conditions, the predictions will be wrong. CFD also assumes steady-state conditions; it can’t account for transient effects like doors opening or personnel movement. CFD also requires specialized expertise, typically requiring outsourcing to a consulting firm.
When to use Physical Testing:
- Existing facilities: Physical testing directly measures what’s actually happening
- Troubleshooting active problems: Gives you immediate evidence and lets you verify corrective actions quickly
- Regulatory validation: Regulators expect to see actual measurement data in your quality records
- Post-modification verification: Confirms that your changes actually solved the problem
Combining CFD and Physical Testing
The most effective approach uses both methods strategically. Use CFD during design and planning phases to optimize your cleanroom layout before construction. Use physical testing during initial validation to confirm that the built facility matches design predictions. Then use physical testing periodically during operation to detect degradation or new dead zones.
If physical testing reveals dead zones that rebalancing can’t fix, return to CFD to model potential redesigns. For most facilities, the practical workflow is: conduct baseline smoke visualization to identify suspect zones, follow with ISO 14644-3 velocity profiling to quantify the problem, then implement HVAC rebalancing.
Step 4: Rebalance Your HVAC System
Once you’ve identified dead zones through visualization and velocity profiling, rebalancing your HVAC system is the primary corrective action. Rebalancing adjusts air distribution to eliminate stagnation and restore airflow uniformity.
Rebalancing in New or Recently Validated Cleanrooms
In newly constructed cleanrooms, dead zones typically result from HVAC design oversights or equipment placement that wasn’t optimized during the design phase. Rebalancing adjusts dampers and VAV boxes to redistribute air from high-velocity zones to low-velocity zones.
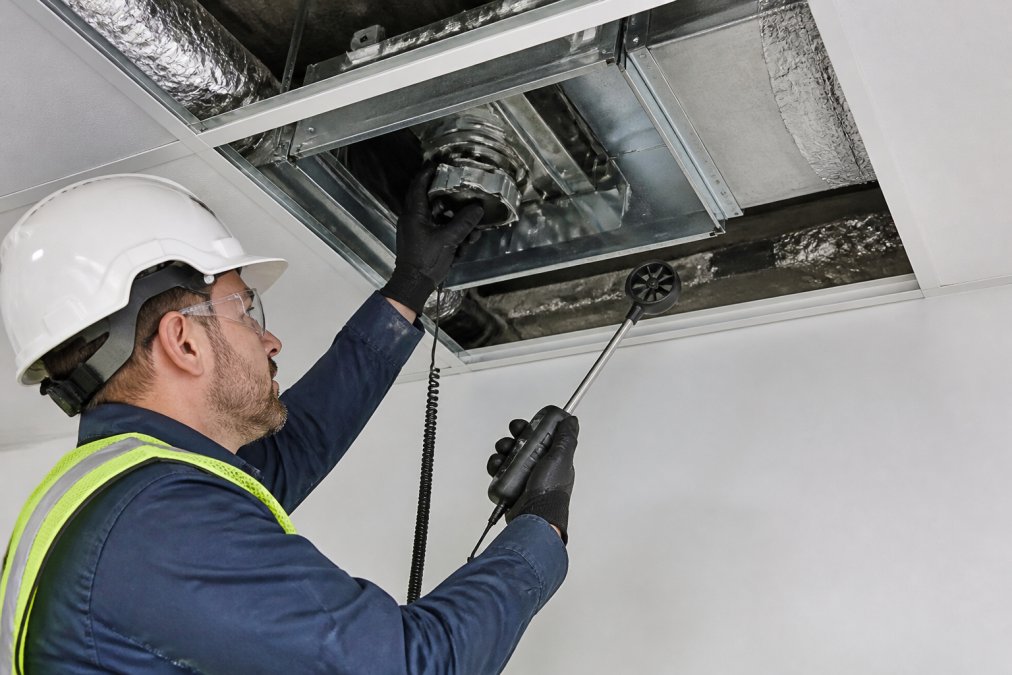
Rebalancing workflow:
- Identify which supply air diffusers or VAV boxes feed air to dead zones
- Reduce airflow volume from diffusers serving high-velocity zones
- Increase airflow volume from diffusers serving low-velocity zones
- Make adjustments incrementally; large changes can create new dead zones elsewhere
- Re-test with velocity profiling after each adjustment to verify improvement
- Continue iterating until velocity distribution meets ISO 14644-3 requirements
Common rebalancing adjustments include damper repositioning, diffuser adjustment, VAV box tuning, and supply air plenum modifications. This process requires technical expertise, as HVAC systems are interconnected and adjusting one zone affects others.
Maintenance-Based Troubleshooting in Aging Facilities
Most cleanrooms in operation today are 5, 10, or 20+ years old. In aging facilities, dead zones often result from HVAC system degradation that develops gradually over time, requiring a different troubleshooting approach.
Filter loading and pressure drop: Supply air filters accumulate dust over months of operation. As filter resistance increases, airflow volume decreases. Replace filters on schedule based on differential pressure monitoring. When pressure drop reaches the manufacturer’s recommended maximum (typically 0.5 to 1.0 inches of water column for HEPA filters), change the filter immediately.
Damper drift and seal degradation: Over years of operation, damper seals degrade and damper positions drift from their set points. In a tightly balanced system, this small drift can create new dead zones. Verify damper positions annually using a calibrated anemometer. If velocity has drifted more than 10% from your baseline, re-adjust as needed.
Fan bearing wear and motor degradation: Supply and return air fans wear over time. Detect this by monitoring total airflow volume at your return air grille periodically. If return air velocity has declined despite normal filter maintenance and damper positions, your fan is likely degraded. Plan for fan replacement every 10-15 years as preventive maintenance.
Return air grille blockage: Return air grilles can become partially blocked by dust accumulation or equipment placement changes. Even partial blockage increases resistance and reduces return airflow. Conduct visual inspection of all return air grilles quarterly. Ensure they’re unobstructed and free of dust accumulation.
HVAC system capacity constraints
If your HVAC system lacks sufficient total capacity, rebalancing alone won’t solve the problem. Calculate your cleanroom’s required air change rate based on your ISO classification and operational activity level. For ISO Class 5 cleanrooms with moderate activity, the typical requirement is 20-30 air changes per hour. For ISO Class 7, it’s 10-15 air changes per hour (iso.org). If your current HVAC system can’t deliver this volume, you need more air.
If you discover that your HVAC system is undersized, you have three options: reduce operational activity to match system capacity, upgrade the HVAC system to increase total airflow, or implement additional contamination control measures to reduce the burden on the HVAC system.
Documentation of rebalancing and maintenance actions
Maintain records of filter change dates and differential pressure readings, damper adjustment dates and new setpoints, fan performance measurements, return air grille inspections and cleaning, and any HVAC component replacements. This documentation demonstrates that you systematically monitor your HVAC system’s performance and implement preventive maintenance to prevent dead zones from developing.
Documentation and Compliance Validation
Troubleshooting airflow dead zones generates documentation that proves you’ve identified and corrected problems, establishes baselines for future comparison, and demonstrates compliance with regulatory requirements.
Essential documentation includes:
- Baseline velocity profile maps showing dead zones before corrective action
- Photographs or video of smoke visualization tests
- HVAC adjustment records detailing which dampers or VAV boxes were modified
- Post-correction velocity profile maps showing improved airflow uniformity
- Dates and personnel signatures for all testing and adjustments
- Comparison of pre- and post-correction measurements
This documentation demonstrates that you’ve followed a systematic troubleshooting process. For facilities subject to GMP compliance, USP 797 standards, or ISO 14644 certification, this airflow validation documentation is essential.
Establish a schedule for periodic airflow testing, annually for most cleanrooms, more frequently if you’ve experienced contamination issues or made equipment changes. Treat airflow troubleshooting as preventive maintenance, not reactive problem-solving.
| Testing Phase | Frequency | Key Documentation |
|---|---|---|
| Baseline velocity profiling | Initial validation + after major changes | Grid measurements, velocity maps, photos |
| Smoke visualization | Quarterly or after equipment moves | Visual observations, photographs, written notes |
| Post-correction verification | Within 2 weeks of HVAC adjustments | Updated velocity profiles, comparison data |
| Regulatory re-validation | Annually or per protocol | Complete test report, compliance sign-off |
Troubleshooting airflow dead zones in cleanrooms requires systematic testing and precise corrective action. The process starts with visualization, smoke testing reveals where stagnation occurs. Quantitative velocity profiling confirms the severity and extent of dead zones. HVAC rebalancing addresses the root cause by redirecting airflow to eliminate stagnation. Throughout this process, documentation demonstrates compliance and creates a record for future reference.
Applied Physics supports this work through precision cleanroom foggers and particle counters that enable accurate airflow visualization and measurement. Our equipment has been trusted by pharmaceutical manufacturers, semiconductor fabricators, and biotech research centers since 1992 because it delivers the precision and reliability these critical environments demand. Contact us to discuss how our airflow testing solutions can help you maintain cleanroom integrity and ensure regulatory compliance.
Frequently Asked Questions
Q: What causes airflow dead zones in cleanrooms?
A: Dead zones form when airflow patterns become turbulent or stagnant due to equipment placement, poor HVAC design, inadequate air change rates, or obstructed return vents. Corners, recessed areas, and spaces behind large equipment are common dead zone locations. Improper pressure differentials between supply and return can also trap contaminated air. Identifying the root cause requires systematic testing with smoke visualization and particle counting to map actual airflow patterns rather than relying on design specifications alone.
Q: How does an airflow visualization test help identify dead zones?
A: Airflow visualization tests use smoke or fog to make invisible air currents visible, revealing stagnant pockets and turbulent zones that particle counters alone cannot show. Applied Physics cleanroom foggers produce neutral-density fog that follows actual airflow without biasing results. By observing fog behavior in real time, technicians can pinpoint exactly where air stagnates, where velocity drops below specification, and where contamination might accumulate, critical information for GMP compliance documentation.
Q: What is the difference between ISO 14644-3 airflow testing and smoke visualization?
A: ISO 14644-3 defines the formal testing methodology and acceptance criteria for cleanroom airflow validation, including velocity profiles, uniformity requirements, and documentation standards. Smoke visualization is one practical tool used during ISO 14644-3 testing to observe airflow patterns qualitatively. Together, they provide both the regulatory framework and the hands-on technique needed to validate that your cleanroom meets design specifications and maintains contamination control throughout its operational life.
Q: When should I revalidate my cleanroom airflow after making changes?
A: Revalidation is required after any modification affecting airflow: equipment relocation, HVAC adjustments, filter replacement, or structural changes. For ongoing compliance under GMP and USP 797/800 standards, most facilities perform annual or semi-annual airflow mapping. If you detect dead zones during routine monitoring, rebalance immediately and document the correction with full ISO 14644-3 testing before resuming critical operations. Real-time monitoring systems can flag velocity deviations automatically, triggering revalidation before contamination risk increases.
