
Table of Contents
- What Is Cleanroom Airflow Visualization and Why ISO 7 Facilities Need It
- Regulatory Compliance and Annex 1 Requirements for ISO 7
- Cleanroom Smoke Study Requirements for Validation
- The Role of Smoke Studies in Identifying Airflow Turbulence and Dead Zones
- Cleanroom Airflow Visualization Tools: Options and Capabilities
- Best Practices for Cleanroom Smoke Studies
- Cost-Benefit Analysis: Is the Investment Justified for ISO 7?
- DIY vs. Professional Third-Party Services for Airflow Visualization
- Common Mistakes in Smoke Study Execution and How to Avoid Them
- Troubleshooting Common Airflow Failures in ISO 7 Cleanrooms
- Frequently Asked Questions
Last Updated: August 18, 2026
What Is Cleanroom Airflow Visualization and Why ISO 7 Facilities Need It
Cleanroom airflow visualization uses aerosol particles and photometric detection to map and verify airflow patterns within controlled environments. For ISO 7 cleanrooms, it validates that your facility maintains the unidirectional or turbulent flow patterns required by regulatory standards. Without it, you’re assuming your HEPA filters and air handling systems perform as designed rather than proving it.
Regulators don’t accept assumptions as evidence of compliance. They require documented proof that airflow patterns meet specification, dead zones don’t exist where they shouldn’t, and your cleanroom maintains the required cleanliness class under operational conditions.
Applied Physics has spent over three decades helping facilities validate critical environments using precision aerosol generators and photometers. The company’s approach focuses on identifying whether airflow moves in the right direction at the right velocity and where it’s failing.
ISO 7 cleanrooms demand 100,000 to 350,000 particles per cubic foot at 0.5 microns. Achieving that consistently depends entirely on predictable airflow. A smoke study reveals turbulence, recirculation zones, and particle ingress points that filter replacement alone cannot fix.
Cleanroom airflow visualization is the documented proof that your facility maintains the cleanliness class you claim. Without it, you’re relying on assumptions instead of evidence.
Regulatory Compliance and Annex 1 Requirements for ISO 7
Annex 1 of the European Pharmaceutical Inspection Co-operation Scheme (PIC/S) and equivalent FDA guidance establish the validation framework for aseptic processing environments. Both require Grade B (ISO 7) cleanrooms to undergo initial qualification and periodic requalification demonstrating that airflow patterns meet design specifications.
You must validate that unidirectional airflow achieves the specified velocity profile, typically 0.45 meters per second (±20%) for Grade B spaces. For turbulent flow environments, you must demonstrate that air change rates and pressure differentials maintain the required contamination control strategy.
Annex 1 mandates smoke studies as the primary method for visualizing airflow patterns during qualification. The study must document:
- Airflow direction and uniformity across the critical zone
- Absence of dead zones or recirculation patterns
- Recovery time following operator intervention or equipment placement
- Behavior under dynamic conditions (personnel movement, door openings, equipment operation)
FDA guidance on cleanroom validation specifies that initial qualification must include both static (unoccupied) and dynamic (operational) smoke studies. Many facilities conduct only static studies and miss critical airflow failures that appear when the room is in use.
Conducting smoke studies only in static conditions is a common shortcut that regulators catch immediately. You must validate airflow under operational conditions, with personnel, equipment, and doors opening and closing as they would during actual production.
Cleanroom Smoke Study Requirements for Validation
A cleanroom smoke study begins by defining your critical zone, the area where product exposure risk is highest. For most ISO 7 applications, this is within 12 inches of the product contact point.
The study requires three core elements: an aerosol generator to introduce visualization particles, a photometric detection system to measure particle concentration, and trained personnel to interpret flow patterns and document findings. The visualization agent, typically dioctyl phthalate (DOP) or polydisperse aerosol, is introduced upstream of the critical zone.
Regulatory bodies expect smoke studies to answer specific questions:
-
Does airflow move in the intended direction? For unidirectional flow, particles should travel from ceiling to floor. Any lateral or upward movement indicates a problem.
-
Is velocity uniform across the critical zone? The specification typically requires 0.45 m/s ±20%.
-
Are there dead zones where particles stagnate? Common locations include corners, behind equipment, and above suspended fixtures.
-
How does the room respond to perturbations? When you open a door, move equipment, or have personnel working, does airflow recover quickly to specification? Recovery time is typically required to be under 15-20 minutes.
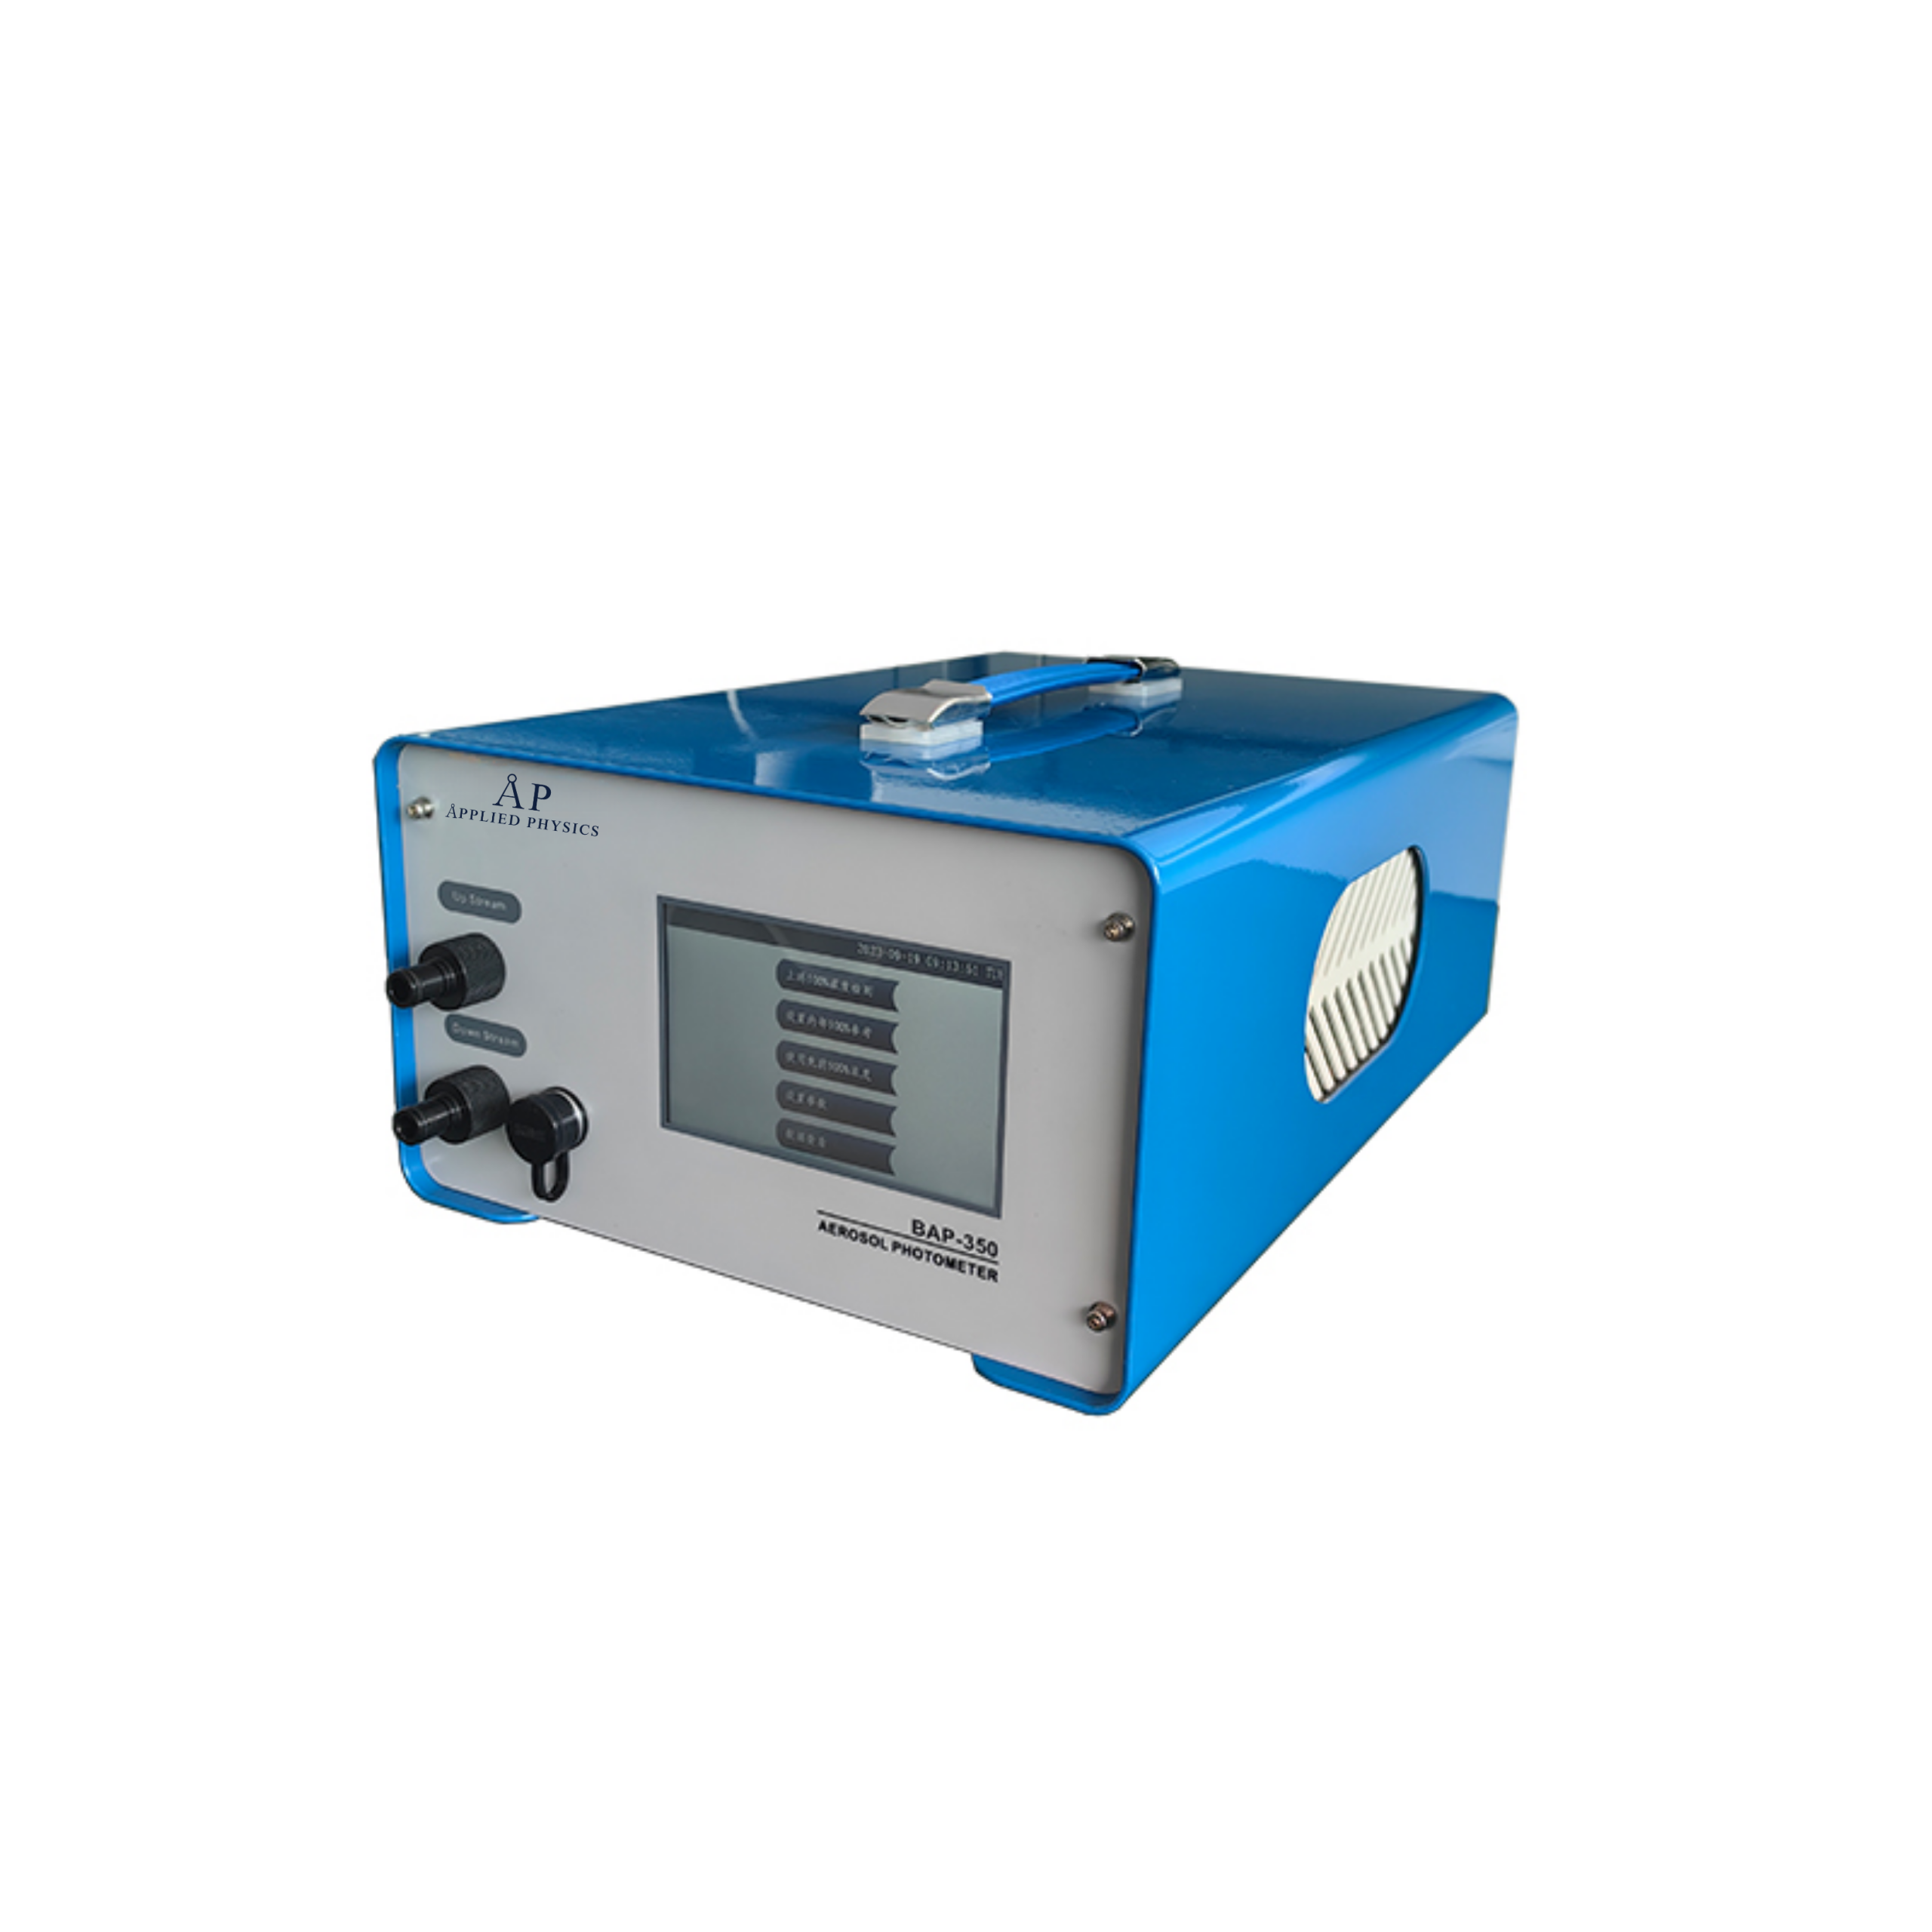
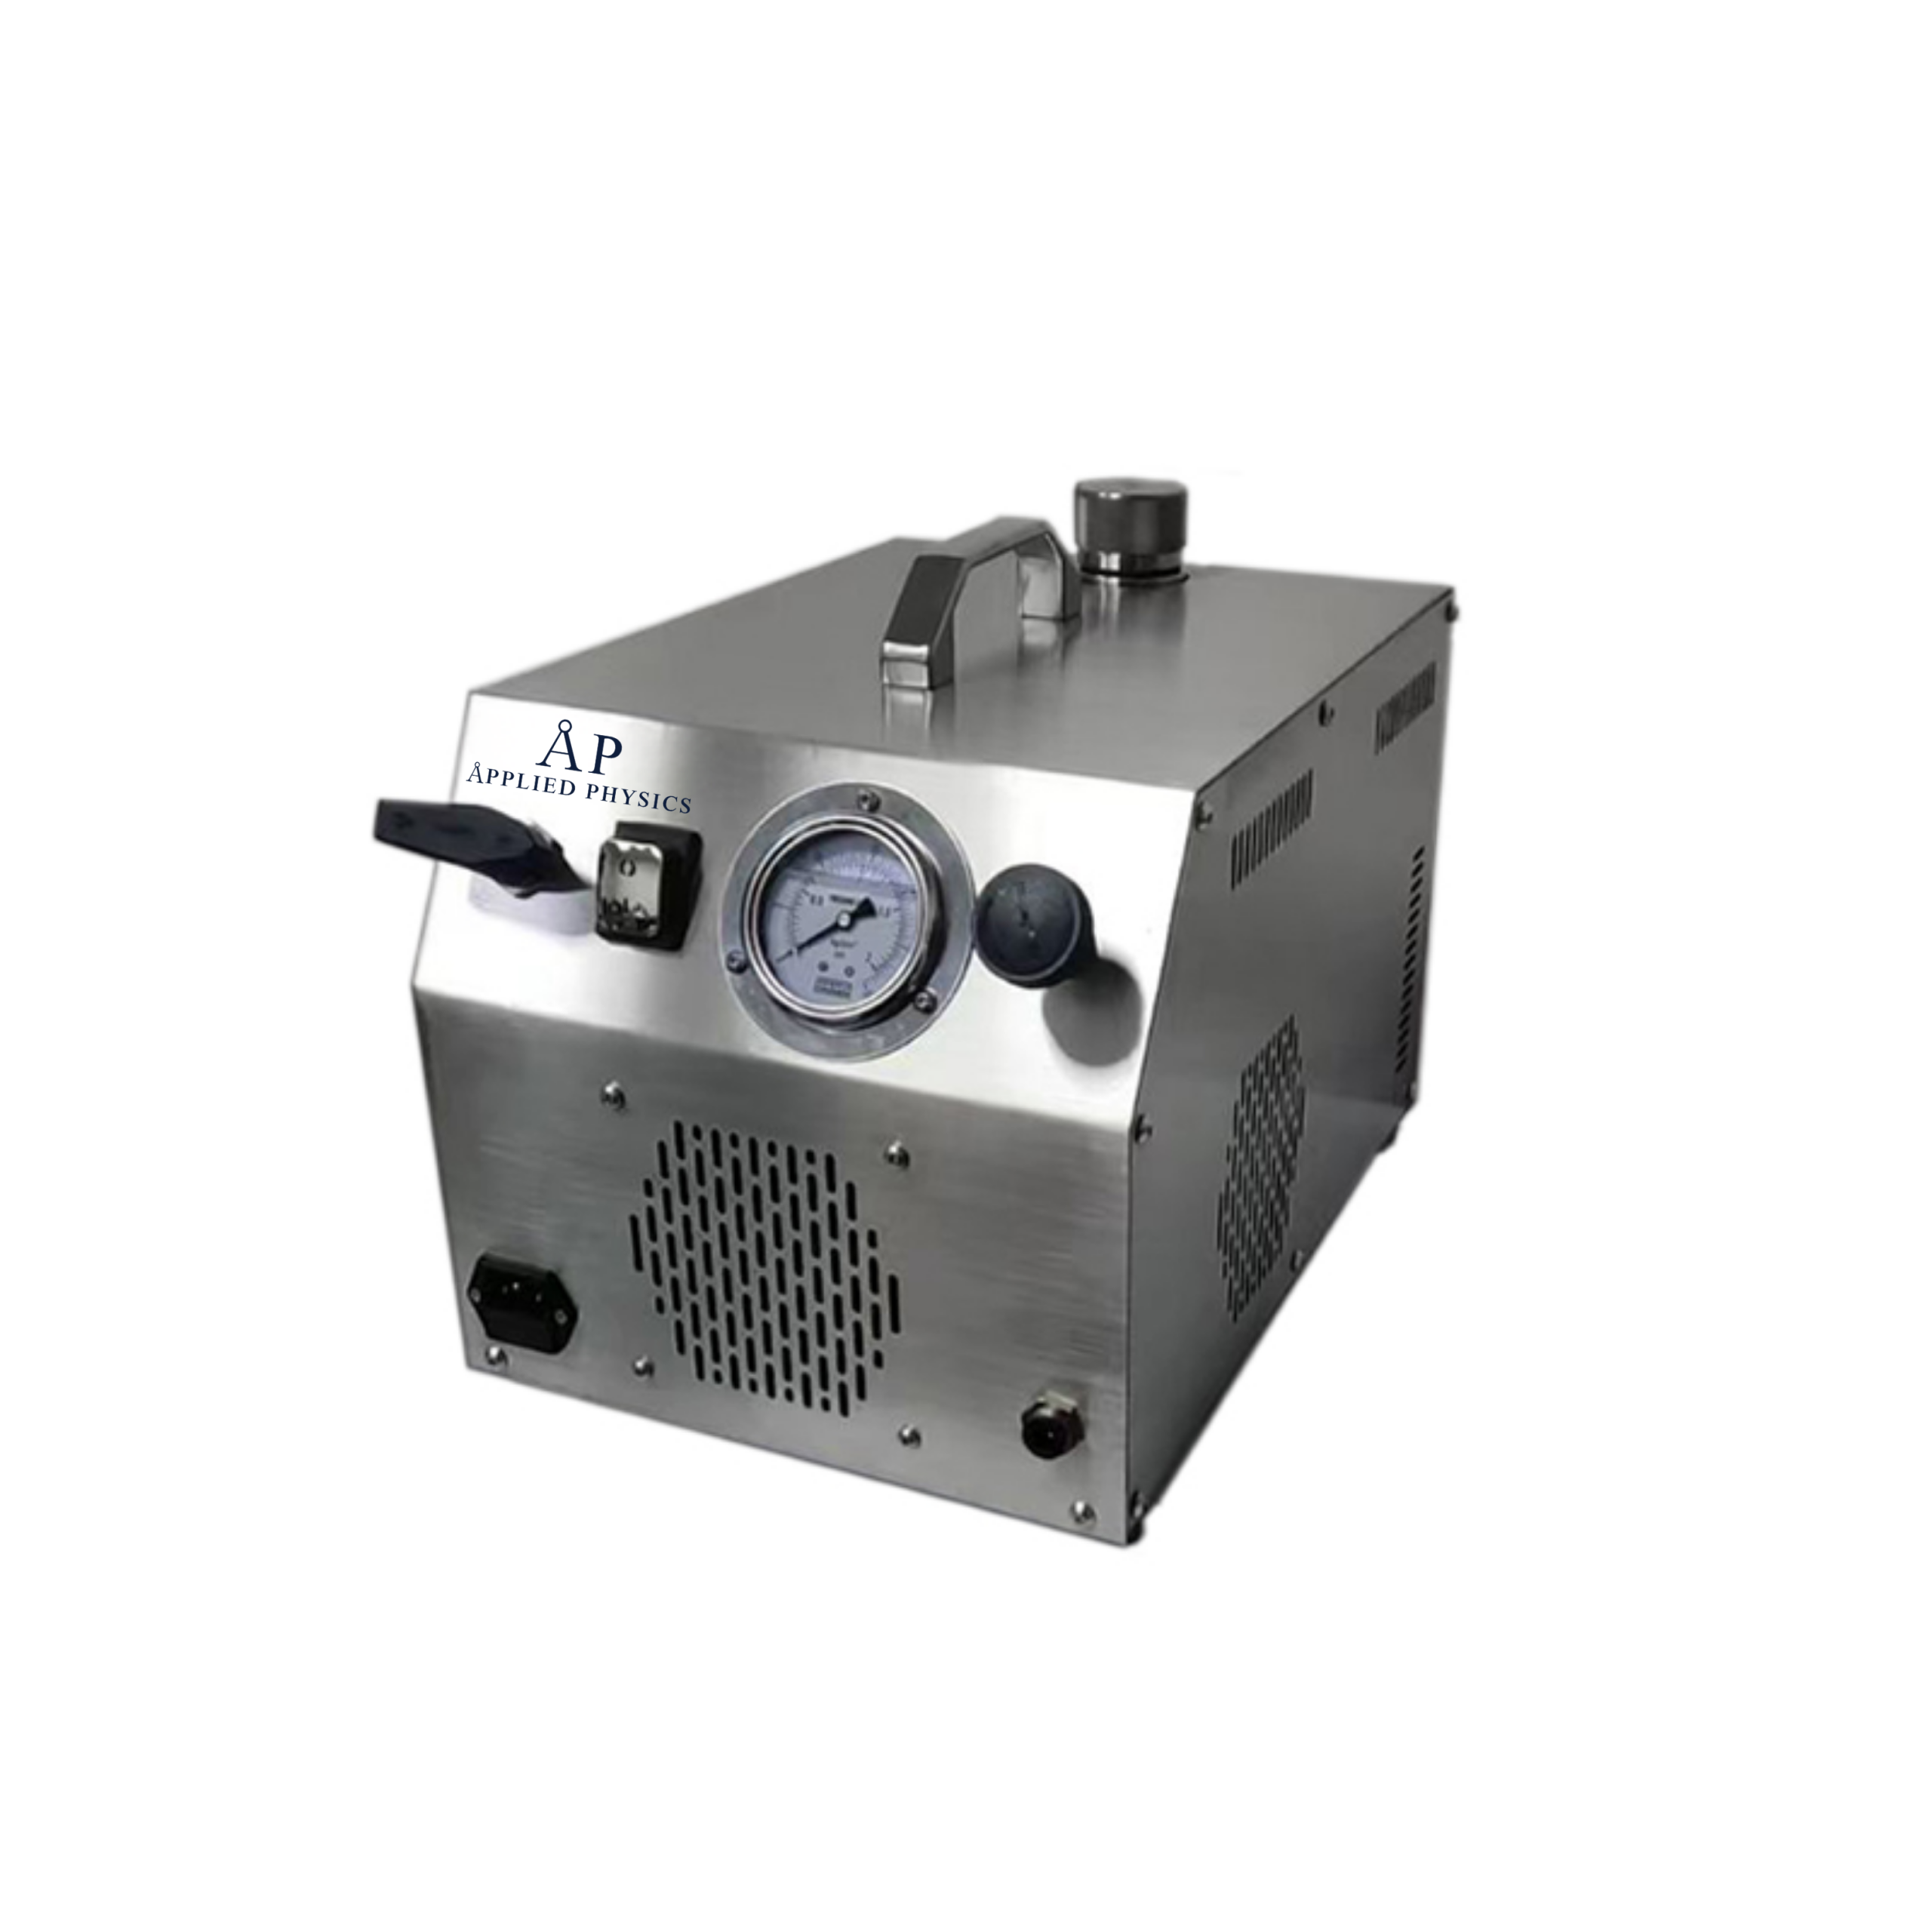
Applied Physics provides the aerosol generators and photometric detection systems needed for rigorous studies. The Aerosol Generator-Cold Type BAG-6D handles flow ranges from 50 to 2,000 CFM. Paired with the Aerosol Photometer BAP-350, which provides real-time measurement of particle concentration and leakage rate, you have the complete system to validate airflow patterns with the precision regulators expect.
The Role of Smoke Studies in Identifying Airflow Turbulence and Dead Zones
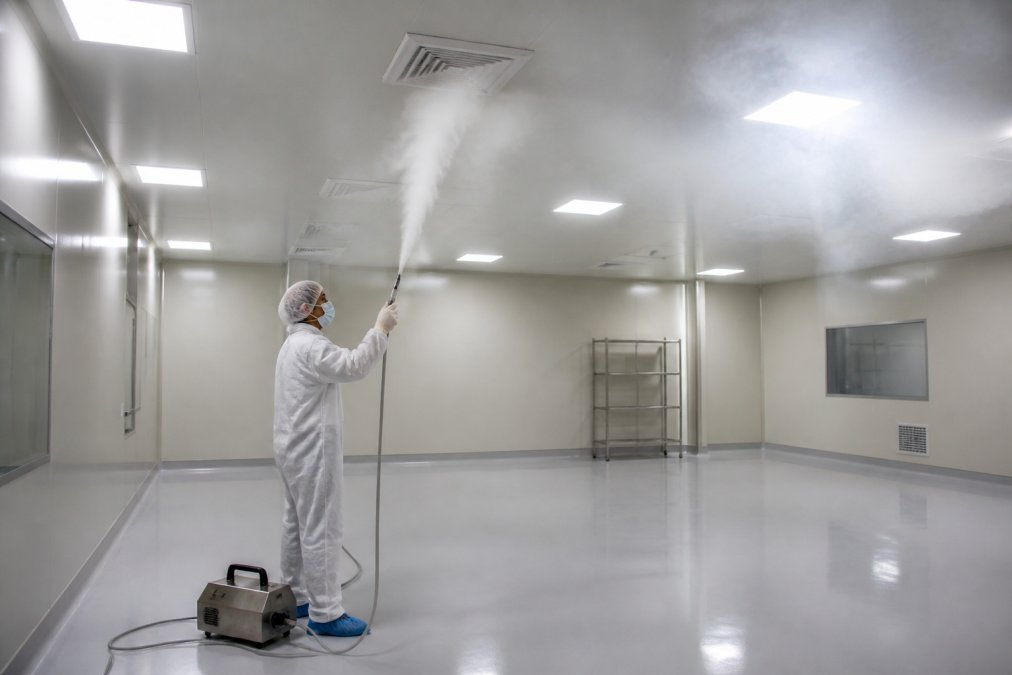
Turbulence and dead zones are the two airflow failures that smoke studies expose most clearly.
Turbulence appears as swirling, chaotic particle movement instead of flowing in a straight, predictable path. In ISO 7 environments, some turbulence is acceptable, but excessive turbulence indicates that airflow velocity is too low, air distribution is uneven, or obstacles are creating vortices.
Dead zones are areas where particles barely move. Smoke lingers, accumulates, and settles. These are contamination risks because airborne particles that settle in dead zones can later become resuspended. Dead zones commonly form in corners, behind large equipment, in recessed areas, above suspended ceilings, and in stagnant areas created by conflicting airflow patterns.
A smoke study reveals these zones immediately. As the visualization agent moves through the space, you see exactly where it travels and where it stalls. This visual evidence is what regulators want to see in your qualification report.
Dead zones often only appear under specific conditions. A room might have acceptable airflow during a static study but develop dead zones when equipment is positioned for production or when personnel are working. This is why dynamic smoke studies are essential.
Record your smoke studies on video. Video demonstrates the entire flow pattern and recovery behavior, and is far more convincing during audits than written descriptions.
Cleanroom Airflow Visualization Tools: Options and Capabilities
Aerosol Generators and Photometers
The equipment you choose determines both the quality of your data and the efficiency of your validation process. Aerosol generators come in two types: cold generators and heated generators. Cold generators use compressed air to atomize liquid aerosol into fine particles. For most ISO 7 smoke studies, cold generators are sufficient and more cost-effective.
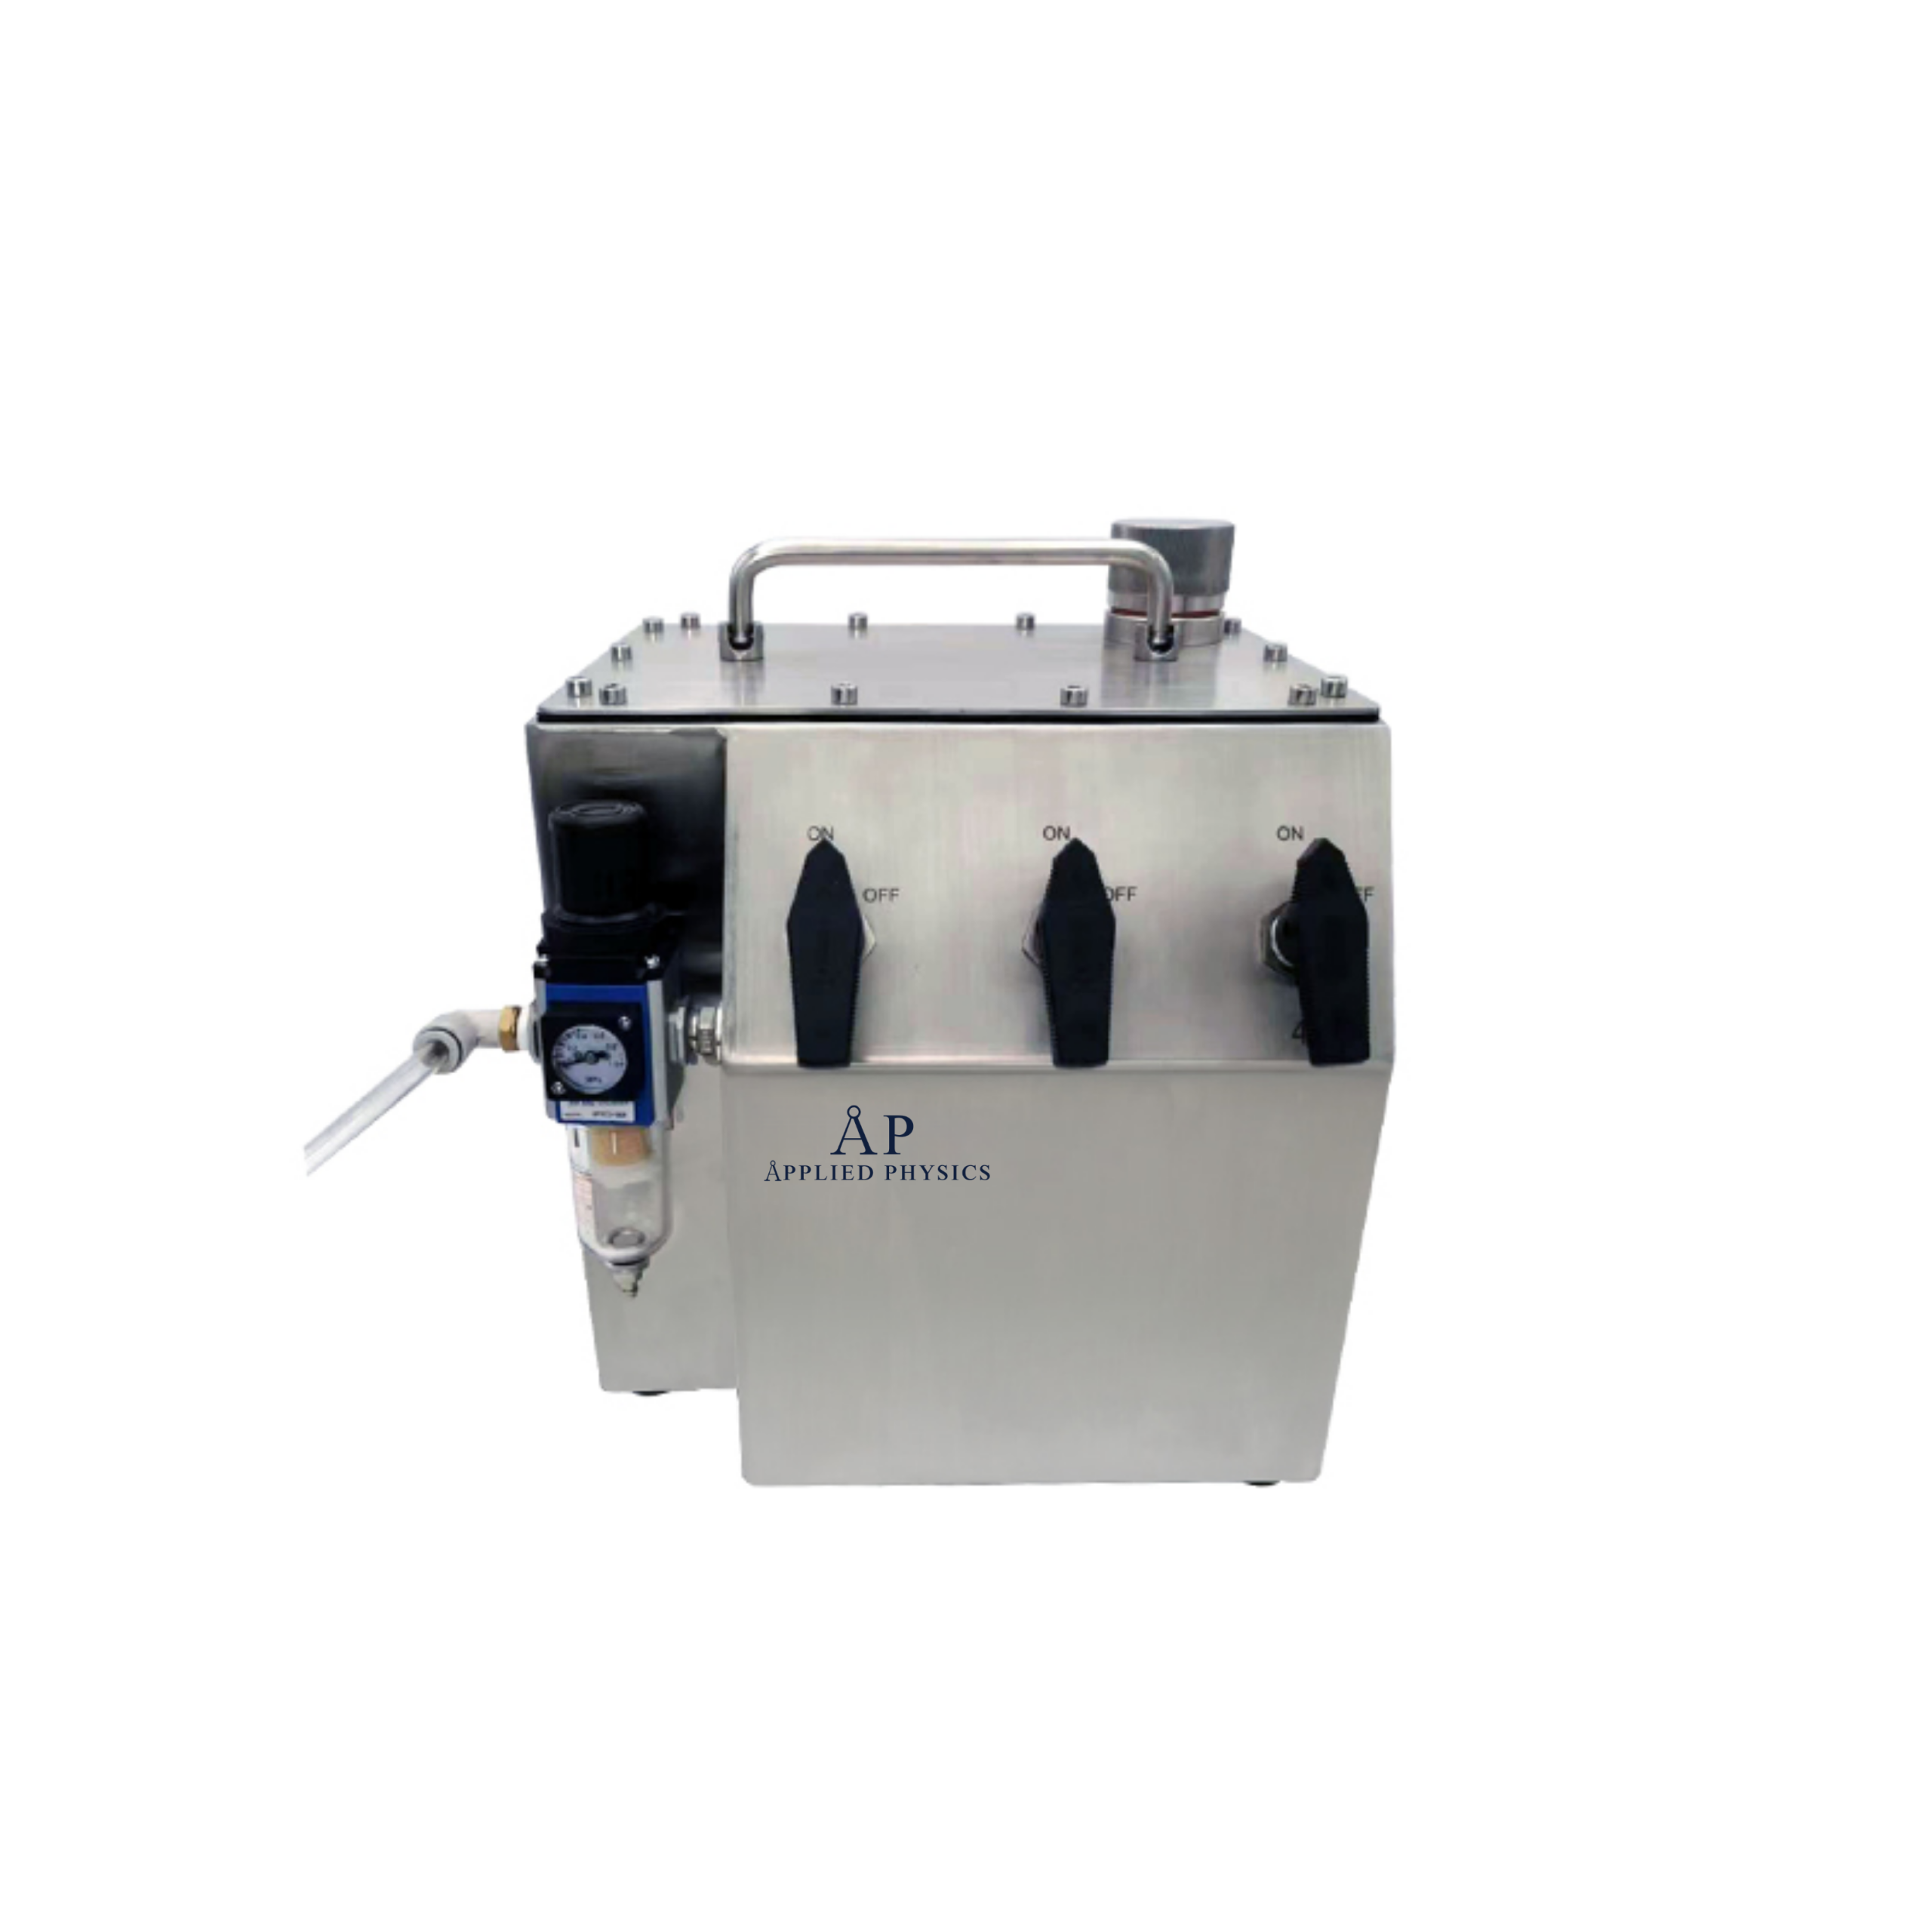
The Applied Physics Aerosol Generator-Cold Type BAG-4B is designed for smaller spaces, glove boxes, biosafety cabinets, and localized cleanroom areas. It operates on compressed air (3-18 CFM at 20 PSI) with no external power requirement. It uses Laskin nozzles (1-7 adjustable) to control particle output from 50 to 8,100 CFM.
For larger facilities, the Aerosol Generator-Cold Type BAG-6D scales up to 2,000 CFM with a built-in oil-less air compressor. It includes 2 or 6 Laskin nozzles and handles the full range of visualization agents (PAO, DEHS, DOP, polydispersed particles). The BAG-6D is the workhorse for ISO 7 facility validation.
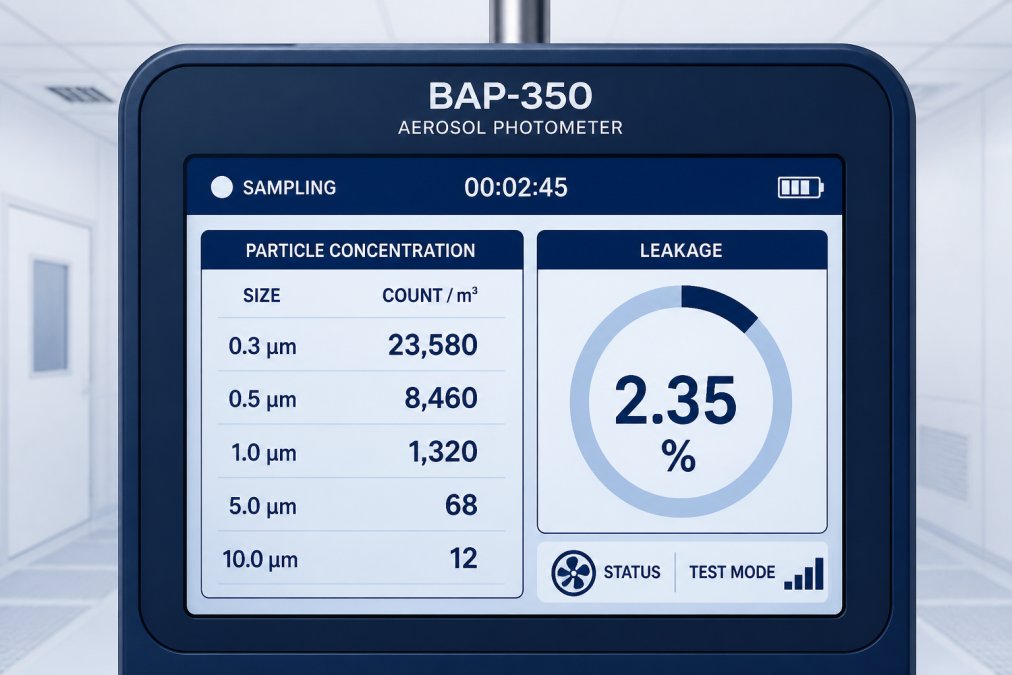
The Aerosol Photometer BAP-350 provides real-time measurement of particle concentration (0.0001% to 100%) and displays leakage rate directly on a 5-inch color touch screen. The portable scanning probe lets you move through the cleanroom and measure airflow at multiple points without running cables back to a stationary unit.
The BAP-350’s dynamic range of 0 to 120 mg/m³ covers the sensitivity needed for HEPA validation and cleanroom classification testing. Its flow rate is fixed at 1 CFM (28.3 L/min ±5%), which is standard for pharmaceutical cleanroom testing. The BAP-350 automatically switches between upstream and downstream measurement modes, essential for calculating actual leakage rates and determining whether your HEPA filters are performing to specification.
Integration with Continuous Monitoring Systems
Modern ISO 7 facilities increasingly integrate particle monitoring into continuous systems rather than relying solely on periodic smoke studies. Smoke studies show whether airflow patterns are correct. Continuous monitors tell you whether the cleanroom is maintaining the required cleanliness class day-to-day.
Continuous particle counters track particle concentration in real time and alert you immediately if levels exceed specification. They don’t replace smoke studies, they complement them. Best practice is to use smoke studies to identify critical measurement points, then position continuous monitors at those locations for ongoing verification.
Applied Physics provides both the validation tools (aerosol generators and photometers for smoke studies) and the instrumentation that can be integrated into continuous monitoring networks.
Facilities conducting initial ISO 7 qualification or major revalidation projects. Smoke studies are non-negotiable for regulatory approval; continuous monitoring is the operational follow-up.
Best Practices for Cleanroom Smoke Studies
Conducting a smoke study that regulators will accept requires attention to detail at every step.
Plan your study before you begin. Define the critical zones, identify measurement points, document the room configuration, and establish acceptance criteria. This planning step often reveals gaps or unclear airflow design specifications.
Conduct both static and dynamic studies. Static means the room is unoccupied and operating at design conditions. Dynamic means personnel are present, doors are opening and closing, and equipment is running as it would during production. Both are required by Annex 1 and FDA guidance.
Document everything. Photograph or video the entire study. Record the date, time, room conditions (temperature, humidity, pressure differential), equipment used, operator name, and acceptance criteria. Regulators want to see evidence, not just a summary report.
Test recovery time after perturbations. Open a door, move equipment, or have personnel work in the critical zone. Then measure how long it takes for airflow to return to specification. Recovery time is a regulatory requirement and a practical indicator of whether your room can maintain cleanliness during actual production.
Use the same equipment for revalidation studies. If you change photometers or generators, your baseline data becomes less comparable. Applied Physics equipment is designed for consistency and delivers repeatable results across multiple studies. cGMP manufacturing standards.
Validate your validation equipment. The photometer must be calibrated and verified to be working correctly. The aerosol generator must produce consistent particle output. Establish a calibration schedule and maintain records before you conduct any validation.
Regulators will ask to see your equipment calibration certificates. If you can’t produce them, your entire study is suspect.
Cost-Benefit Analysis: Is the Investment Justified for ISO 7?
The cost of cleanroom airflow visualization includes equipment acquisition, labor for conducting studies, and facility downtime during validation.
Equipment costs vary by scale. A basic smoke study setup for small facilities runs significantly less than comprehensive systems for larger ISO 7 suites. These are one-time or infrequent purchases; the equipment lasts for years.
Labor costs are ongoing. Each smoke study requires trained personnel, time to set up and conduct the test, and time to analyze and document results. A comprehensive ISO 7 facility study typically takes 2-4 days depending on room size and complexity.
Downtime during validation is the hidden cost many facilities underestimate. If you’re validating an active production cleanroom, you need to shut down operations during the study.
But weigh those costs against the alternatives: regulatory audit findings, product recalls due to contamination failures, or patient harm if your cleanroom wasn’t actually maintaining the cleanliness class you claimed. A failed audit can shut down your facility for weeks while you investigate root causes and revalidate. A product recall is exponentially more expensive than the cost of a smoke study.
For pharmaceutical operations handling sterile products, validation is mandatory, not optional. The real question isn’t whether to do smoke studies, but whether to do them properly with adequate equipment and methodology or to cut corners and hope auditors don’t look too closely.
DIY vs. Professional Third-Party Services for Airflow Visualization
Some facilities conduct smoke studies in-house; others hire specialized third-party service providers.
In-house advantages: You control the schedule, own the equipment, and can conduct studies whenever needed. For facilities conducting frequent studies, in-house capability makes economic sense. You also build internal expertise.
In-house disadvantages: You need to invest in equipment, train personnel, and maintain documentation systems. You’re responsible for equipment calibration and verification. Regulators scrutinize in-house studies more closely because there’s no independent verification of methodology.
Third-party advantages: You get independent, defensible documentation. Third-party providers are trained in regulatory expectations and best practices. Their reports carry weight in audits. You avoid capital equipment investment and liability risk.
Third-party disadvantages: Cost per study is higher, and you’re dependent on vendor scheduling. You don’t build internal expertise. For ongoing operations, third-party studies become an ongoing expense.
A hybrid approach is common: facilities invest in equipment for routine in-house monitoring and periodic self-studies, then hire third-party providers for major revalidation or when regulatory issues arise.
If you choose in-house capability, Applied Physics equipment is designed for this purpose. The BAG-6D and BAP-350 provide the same measurement capability third-party providers use.
Common Mistakes in Smoke Study Execution and How to Avoid Them
Many facilities conduct smoke studies but make execution errors that compromise validity.
Mistake 1: Using the wrong aerosol type. DOP is traditional but can degrade HEPA filters at high concentrations. DEHS and PAO are alternatives. Know your generator’s specifications and match the aerosol to your application.
Mistake 2: Insufficient particle concentration. If your smoke is too light, you can’t see airflow patterns clearly. If it’s too heavy, you oversaturate the space and get false readings. Adjustable generators let you dial in the right concentration.
Mistake 3: Measuring at the wrong points. Dead zones are often in hard-to-reach areas. You need to measure systematically across the entire critical zone, including corners, behind equipment, and above work surfaces.
Mistake 4: Conducting only static studies. A room might pass a static smoke study but fail under operational conditions. You must validate under dynamic conditions.
Mistake 5: Inadequate documentation. Regulators want to see photographs, videos, measurement data, and written descriptions. If you can’t show what the smoke did, you can’t prove what the airflow is doing.
Mistake 6: Failing to establish recovery time criteria. Establish your recovery time limit (typically 15-20 minutes) before the study, then measure and document actual recovery time.
Mistake 7: Using uncalibrated or unverified equipment. If your photometer hasn’t been calibrated recently, your measurements are questionable. If your generator hasn’t been verified to produce consistent output, your aerosol concentration is uncertain.
Regulators will ask to see your equipment calibration certificates. If you can’t produce them, your entire study is suspect.
Troubleshooting Common Airflow Failures in ISO 7 Cleanrooms
When a smoke study reveals airflow problems, you need a systematic approach to identify and correct the root cause.
Unidirectional airflow is non-uniform or slow. This typically indicates filter loading or air distribution problems. Check HEPA filter condition; a loaded filter reduces velocity. Verify that supply air diffusers are clean and unobstructed. If filters and diffusers are clean, the problem is likely in HVAC design, ductwork sizing, fan capacity, or damper settings.
Airflow direction is wrong or reversed. Check room pressure differential relative to adjacent spaces. If the room is under-pressurized, air will flow inward rather than outward as designed. Verify that exhaust air handling is working correctly. A simple adjustment to dampers or fan speeds may correct the problem; in other cases, it indicates a design flaw requiring HVAC system modification.
Dead zones persist in specific locations. Dead zones often indicate uneven air distribution or obstacles blocking flow. Repositioning equipment, removing unnecessary fixtures, or adjusting supply air diffuser angles can sometimes resolve this. In other cases, the cleanroom design itself creates unavoidable dead zones, and the solution is to exclude those areas from your critical zone definition.
Recovery time is too long. Long recovery times suggest low air change rates or poor air distribution. Increasing fan speed (if the HVAC system allows) or improving air distribution design can help. In some cases, the design air change rate is simply inadequate, and you need to upgrade the HVAC system.
Airflow patterns change unpredictably. Check for uncontrolled air leaks, drafts from doors or windows, or thermal effects from equipment. Verify that room pressure is stable and that adjacent spaces aren’t creating cross-contamination paths.
The Applied Physics aerosol photometer is valuable for troubleshooting because it provides real-time data. You can measure at multiple points, adjust conditions, and remeasure to see the effect of changes.
The bottom line: Cleanroom airflow visualization is the foundation of your contamination control strategy. Without it, you’re operating on assumptions. With it, you have documented proof that your ISO 7 cleanroom actually maintains the cleanliness class you claim.
Applied Physics has supported cleanroom validation since 1992. The company’s aerosol generators and photometric systems are built specifically for this work, precision instruments that deliver the data quality regulators expect and the reliability you need for ongoing operations. Whether you’re conducting initial qualification or periodic revalidation, the equipment and methodology matter. Get them right, and you have a defensible validation. Cut corners, and you’re exposed to audit findings, recalls, or worse.
| Study Type | Frequency | Best For | Key Benefit |
|---|---|---|---|
| Static smoke study | Initial qualification, annual revalidation | Baseline airflow validation | Establishes design performance |
| Dynamic smoke study | Initial qualification, biennial revalidation | Operational reality testing | Reveals failures under real-world conditions |
| Continuous monitoring | Ongoing (daily/weekly) | Operational assurance | Early warning of airflow degradation |
| Recovery time testing | Initial qualification, as needed | Contamination control verification | Demonstrates resilience to perturbations |
Contact Applied Physics to discuss your cleanroom validation requirements. The team can help you design a validation program that meets regulatory expectations, protects your operation, and gives you confidence in your contamination control strategy.
Frequently Asked Questions
Is smoke testing mandatory for ISO 7 cleanroom certification?
Smoke testing is not explicitly mandated for ISO 7 classification alone, but Annex 1 guidance and GMP compliance strongly recommend airflow visualization studies during performance qualification and after significant changes. ISO 7 facilities handling aseptic processing or sterile operations should treat smoke studies as essential validation tools. Regulatory inspectors expect evidence of unidirectional airflow patterns and the absence of dead zones, smoke studies provide that visual proof.
What are the regulatory requirements for airflow visualization in ISO 7 cleanrooms?
Annex 1 requires cleanroom airflow patterns to be validated during initial qualification and revalidated after modifications. For ISO 7 environments, you must demonstrate unidirectional airflow with adequate velocity profiles, verify pressure differentials between zones, and confirm the absence of particle ingress and turbulence. Cleanroom smoke study requirements include documenting airflow patterns at critical zones where aseptic work occurs, with recovery time measurements after personnel intervention.
How often should airflow visualization studies be performed in an ISO 7 facility?
Initial performance qualification requires comprehensive smoke studies before operations begin. Routine monitoring depends on your risk-based approach: high-risk aseptic areas may need annual or biennial studies, while lower-risk zones may be validated every 2-3 years. After equipment changes, gowning modifications, or failed particle counts, immediate re-visualization is necessary. Continuous monitoring systems can supplement periodic smoke studies to track velocity and pressure trends between formal validations.
What are the common pitfalls in ISO 7 airflow visualization studies?
Common mistakes include improper visualization agent selection (using unsuitable aerosols for your HEPA filter type), inadequate sampling points that miss dead zones, testing during abnormal personnel density or equipment operation, and failing to document recovery time after operator intervention. Many facilities neglect to test critical zones where aseptic operations occur, or they conduct studies under ideal conditions that don’t reflect actual production. Poor documentation and inconsistent methodology also compromise regulatory credibility.
How does cleanroom airflow visualization help identify dead zones in an ISO 7 environment?
Smoke studies visually reveal areas where airflow stagnates or recirculates, creating dead zones where particles can accumulate. By introducing visualization agent and observing flow patterns, you can spot turbulence pockets behind equipment, in corners, or under work surfaces where unidirectional airflow fails. This helps you reposition equipment, adjust FFU placement, or modify gowning procedures to eliminate contamination risks. Dead zone identification is critical for aseptic processing areas where product exposure to airborne particles poses compliance and safety risks.
