
Table of Contents
- What Particle Metrology Means for Nanotechnology Labs
- Particle Size Distribution Analysis: Core Measurement Techniques
- Calibration Wafer Standards for Metrology: Ensuring Accuracy
- Semiconductor Contamination Control Standards and Compliance
- Challenges in Nanoparticle Characterization and Detection
- Instrumentation Sensitivity and Data Validation Protocols
- Practical Lab Workflow Integration and Troubleshooting
- Frequently Asked Questions
Last Updated: October 2, 2026
What Particle Metrology Means for Nanotechnology Labs
Particle metrology for nanotechnology labs is the precise measurement and characterization of nanoparticles, objects smaller than 100 nanometers, to ensure they meet specifications for safety, performance, and regulatory compliance.
The stakes are high. A nanoparticle’s size determines its properties: reactivity, toxicity, optical behavior, and how it moves through biological systems. Get the measurement wrong by even a few nanometers, and you’ve mischaracterized your entire material. According to NIST researchers who identified a common measurement error confounding nanotech measurements, standard measurement techniques have historically distorted the relationship between nanomaterial size and material properties, leading labs to draw incorrect conclusions about their own work.
At Applied Physics, we’ve tracked how the nano metrology market has evolved. The global nano metrology market was valued at USD 3.8 billion in 2026 and is projected to reach USD 5.4 billion by 2035, according to Research Nester’s market analysis. That growth reflects rising demand from semiconductor fabrication, pharmaceutical manufacturing, and research institutions that can no longer afford measurement uncertainty. The nano particle size analyzer segment alone is growing at 7.3% annually, climbing from USD 0.54 billion in 2025 to USD 1.02 billion by 2034.
This guide covers the measurement techniques, calibration standards, and practical workflows that separate labs producing reliable data from those generating noise. Below, we’ll show you exactly how to integrate particle metrology into your lab’s quality control process and avoid the measurement errors that have historically plagued nanotech research.
Particle Size Distribution Analysis: Core Measurement Techniques
Measuring particle size distribution accurately requires understanding which technique matches your material and your tolerance for error. Three dominant approaches dominate the field, each with distinct strengths and limitations.
Dynamic Light Scattering and Photon Correlation Spectroscopy
Dynamic light scattering (DLS) and photon correlation spectroscopy are the same technique, the second name describes the underlying physics. When a laser hits suspended nanoparticles, they scatter light in patterns that fluctuate based on the particles’ Brownian motion.
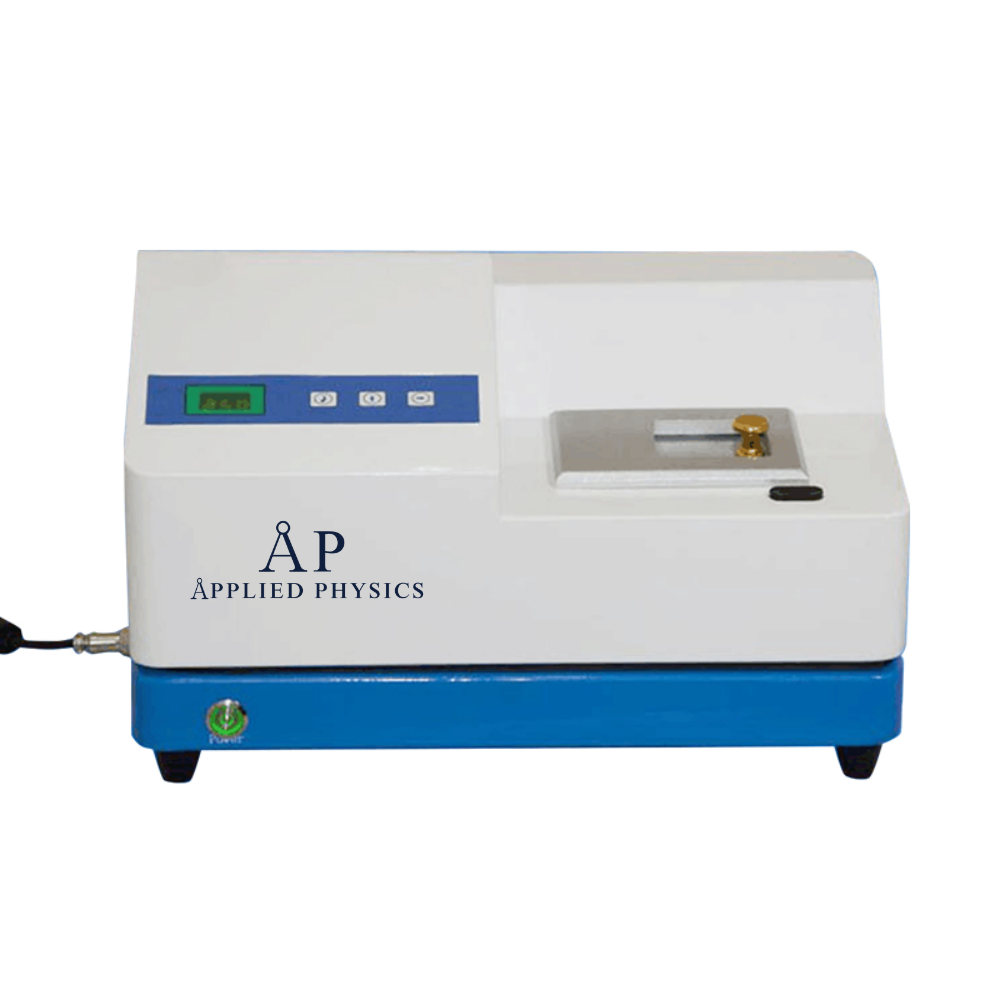
DLS is fast, requires minimal sample preparation, and works well for particles between 0.5 and 10,000 nanometers. Applied Physics’s Nanoparticle Size Analyzer (Customized) uses precisely this principle, employing a professional-grade photomultiplier tube detector and photon correlator with 6-nanosecond resolution to distinguish particle-size-dependent fluctuations that other instruments miss.
The limitation: DLS assumes spherical particles and works best in monodisperse samples (where all particles are roughly the same size). Polydisperse samples, mixtures with wide size ranges, produce averaged results that obscure the actual distribution.
Electron Microscopy for Direct Particle Observation
Transmission electron microscopy (TEM) and scanning electron microscopy (SEM) image nanoparticles directly, bypassing assumptions about shape or size distribution. You can see morphology, aggregation state, surface features, and size simultaneously.
TEM’s advantage is unambiguous: direct observation eliminates model-dependent errors. The disadvantage is equally clear: preparing samples for electron microscopy is labor-intensive, expensive, and requires expertise. Statistical significance demands imaging hundreds or thousands of particles to build a reliable distribution, a process that consumes hours per sample.
Aerosol Measurement and Condensation Particle Counters
For airborne nanoparticles, critical in semiconductor fabrication, pharmaceutical manufacturing, and cleanroom validation, condensation particle counters (CPCs) measure particles as small as 0.01 micrometers by growing them into larger droplets that light-scattering detectors can count. Applied Physics’s Handheld Condensation Particle Counter Model 3800 detects particles down to 0.01 micrometers with measurement concentrations from 0 to 100,000 particles/cm³, making it ideal for filter validation, cleanroom certification, and aerosol research.
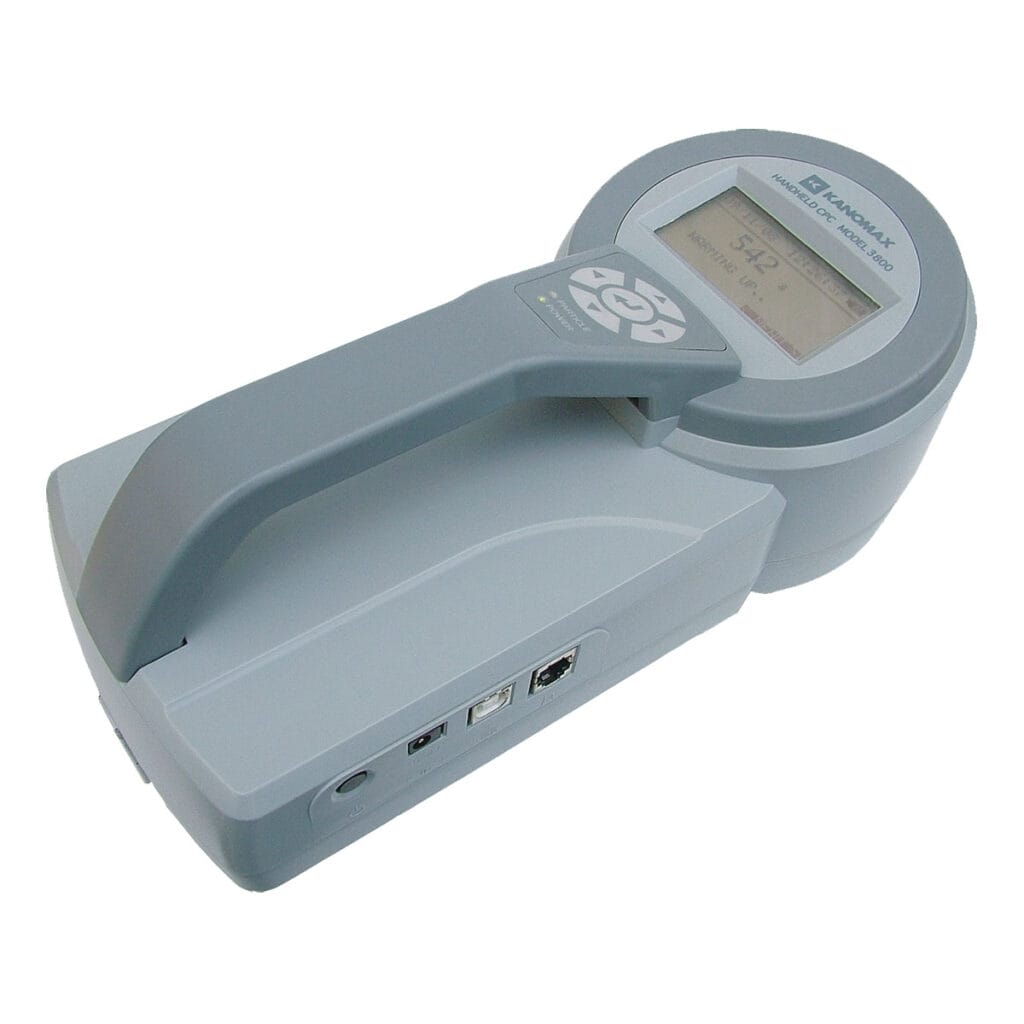
CPCs excel at high-throughput particle counting, a requirement identified by NIST to support rapid measurement of hundreds or thousands of particles to generate accurate statistical distributions. The trade-off: you’re counting particles, not measuring size directly. CPCs give you concentration data; you need additional instruments to resolve size distribution within that population.
Calibration Wafer Standards for Metrology: Ensuring Accuracy
Calibration wafer standards for metrology are the reference materials that anchor all your measurements to a traceable standard. Without them, your particle size data floats, you might be measuring 50-nanometer particles or 55-nanometer particles, and you’d have no way to know which. But calibration is not a one-time event; it’s a continuous process that requires understanding drift mechanisms, selecting appropriate intervals, and documenting traceability.
Traceability and NIST-Traceable Standards
Calibration wafer standards carry metrological traceability, meaning each measurement links back to national standards through an unbroken chain of documentation.
Traceability requires three elements: (1) a certified reference material with a known particle size and documented uncertainty, (2) a calibration procedure that compares your instrument’s response to that reference, and (3) documentation that records the date, result, and any corrective actions taken.
Drift Detection and Frequency Selection
Calibration drift happens silently. Temperature fluctuations, optical degradation, detector aging, and electronic component drift all shift your instrument’s response over time.
Drift detection requires periodic re-measurement of a calibration standard and comparison to the baseline. The frequency you choose depends on your instrument’s stability, your measurement tolerance, and your regulatory environment:
Quarterly calibration (every 3 months) is standard for labs operating under FDA, ISO 13485, or similar regulated environments. This interval catches drift before it exceeds typical measurement tolerances (±5-10%).
Semi-annual calibration (every 6 months) is acceptable for research labs with less stringent tolerance requirements or instruments with demonstrated stability.
Annual calibration is the minimum for non-regulated environments and instruments with documented long-term stability.
The practical decision: match your calibration frequency to your regulatory requirements and measurement tolerance.
Calibration Procedures and Documentation
A defensible calibration procedure includes these steps:
-
Baseline measurement: Measure your certified reference standard three times on your particle size analyzer. Record the mean, standard deviation, and individual results. This establishes your instrument’s current response.
-
Comparison to certificate: Compare your measured values to the certified values on the reference standard’s calibration certificate. Calculate the difference (bias). If bias exceeds your acceptable tolerance (typically ±5% of the certified value), the instrument requires adjustment or service.
-
Adjustment or acceptance: If bias is within tolerance, document acceptance and schedule the next calibration. If bias exceeds tolerance, contact your instrument manufacturer or a certified calibration service for adjustment. Do not measure samples until the instrument passes calibration.
-
Documentation: Record the date, reference standard used, measured values, certified values, bias, pass/fail status, and any corrective actions. Maintain these records for the life of the instrument plus 3-5 years (depending on your regulatory environment).
Labs that skip step 4 inevitably discover, months later during an audit, that they cannot prove their instrument was calibrated or that calibration records are incomplete.
Multi-Point Calibration for Extended Range
If your lab measures particles across a wide size range (e.g., 0.5 nanometers to 10,000 nanometers), a single calibration point may not catch non-linear drift. Consider multi-point calibration using reference standards at the low end (e.g., 50 nanometers), mid-range (e.g., 500 nanometers), and high end (e.g., 5,000 nanometers) of your measurement range.
Cost-Benefit Analysis: Calibration Investment vs. Data Risk
The cost of calibration is measurable: $300-$1,200 per event, plus downtime. The cost of not calibrating is hidden but catastrophic. Consider this scenario:
Your particle size analyzer drifts undetected for 6 months. You measure 200 samples, all reported as 100 ± 5 nanometers. During a customer audit, the customer re-measures 10 of your samples on their instrument and finds they’re actually 108 ± 5 nanometers. Your instrument was drifting at approximately 1.3 nanometers per month. You must now: Reconciling these discrepancies often requires a complete audit of your hardware calibration standards, which may necessitate sourcing replacement components through custom parts manufacturing to restore the precision of your metrology workflow.
- Re-test all 200 samples (40-80 hours of lab time, $2,000-$4,000 in labor)
- Re-qualify your process (20-40 hours, $1,000-$2,000)
- Potentially scrap or rework material (cost depends on your product)
- Explain the failure to your customer and regulatory bodies
- Restore your reputation
Total cost: $5,000-$10,000 or more, plus reputational damage. Quarterly calibration at $600 per event ($2,400 per year) would have caught the drift within 3 months, limiting exposure to 50-100 samples instead of 200.
The math is clear: invest in regular calibration or risk far larger losses.
Always run a calibration standard before measuring unknowns. If your calibration standard doesn’t measure to specification, your instrument needs service, do not measure samples until it’s fixed. This single step prevents hours of wasted analysis on corrupted data.
Semiconductor Contamination Control Standards and Compliance
In semiconductor fabrication, a single stray nanoparticle can kill a chip. Contamination control standards, ISO 14644 for cleanroom classification and SEMI standards for particle limits, define acceptable contamination levels at each production node. At 5-nanometer node production, your particle count limits are measured in the single digits per cubic meter.
Compliance means continuous monitoring and documentation. Your cleanroom must maintain specified particle counts at defined sizes. Applied Physics’s Cleanroom Monitoring System (CRMS) provides continuous oversight, integrating particle counters with differential pressure, temperature, and humidity sensors to track compliance in real time.
The regulatory landscape demands that you prove compliance, not just assume it. Audit trails, calibration records, and particle count logs are non-negotiable. A single failed audit can halt production and trigger expensive re-qualification of your entire process.
Skipping calibration validation is a common mistake. A lab assumes its particle size analyzer is accurate because it was accurate last month, then discovers months of data were systematically biased. The cost of re-testing, re-qualifying, and potentially scrapping material can exceed the cost of regular calibration checks.
Challenges in Nanoparticle Characterization and Detection
Nanoparticle characterization is harder than it sounds, and the literature understates how often measurements fail silently.
Measurement Uncertainty and Statistical Significance
Every particle size measurement carries uncertainty, a range within which the true value probably lies. The challenge is that uncertainty compounds.
Statistical significance demands adequate sample size. A single measurement of one particle tells you almost nothing.
The practical implication: budget time for replication. A single “quick” particle size measurement is not data, it’s a guess. Defensible measurements require multiple runs, multiple samples, and statistical analysis of the results.
Suspension Stability and Sample Preparation
How you prepare your sample determines whether you’re measuring your material or measuring aggregation artifacts. Nanoparticles in suspension want to clump together, it’s thermodynamically favorable.
Automatic Laser Nanoparticle Size Analyzer →
Stabilization requires understanding your material’s surface chemistry. Surfactants, pH adjustment, and sonication all influence suspension stability. A sample that’s stable for 10 minutes may aggregate within an hour.
This is where most labs introduce systematic error.
Instrumentation Sensitivity and Data Validation Protocols
Instrument sensitivity determines what you can actually measure. A detector with high signal-to-noise ratio captures weak scattering signals from small particles. A detector with poor sensitivity misses those signals and reports artificially large particle sizes.
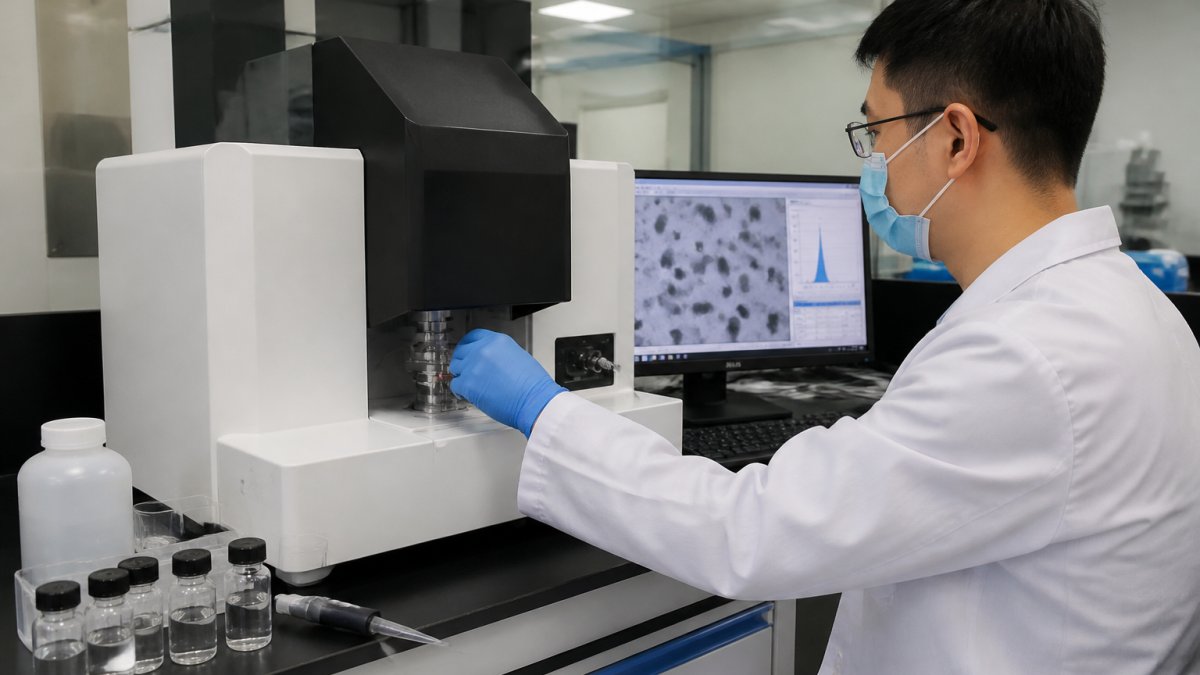
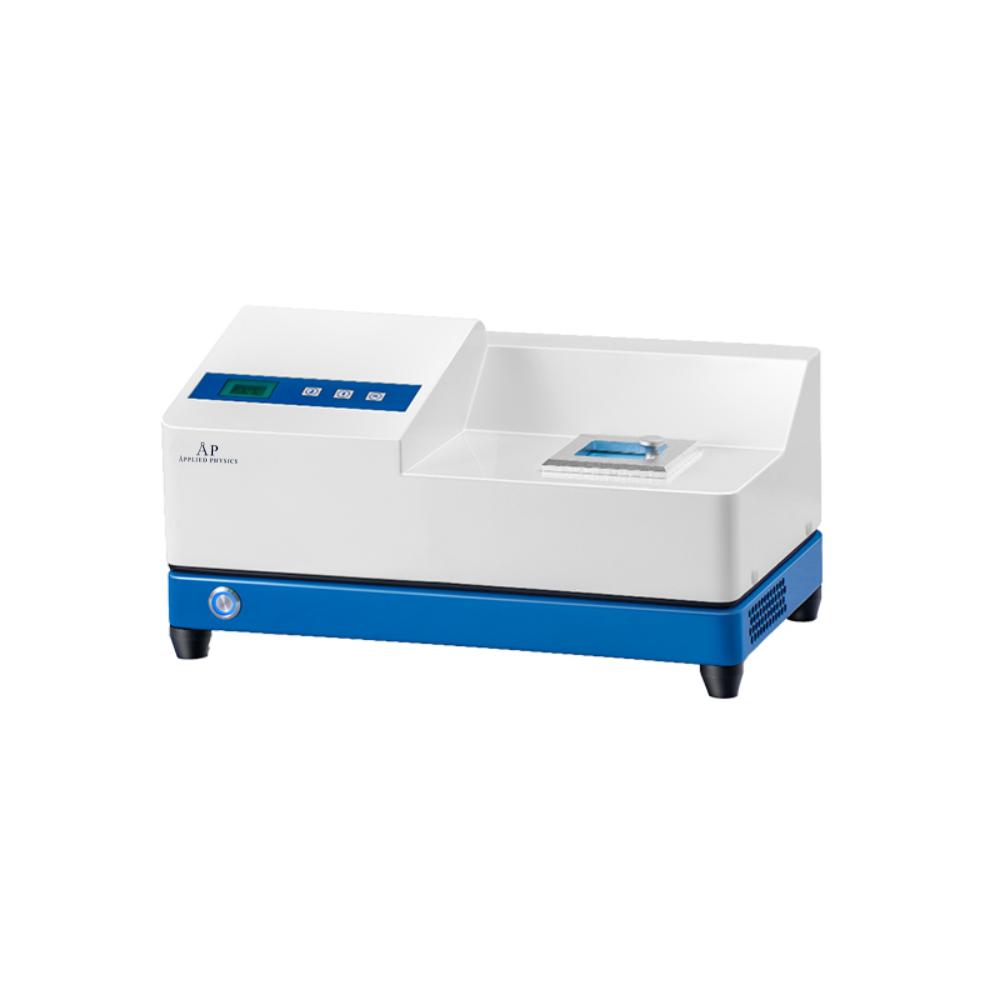
Applied Physics’s Automatic Laser Nanoparticle Size Analyzer uses a Hamamatsu professional-grade photomultiplier tube detector with exceptionally high photon sensitivity and low dark noise. The instrument achieves <1% accuracy and <1% repeatability error across the 0.5 to 10,000-nanometer range. Dual-channel temperature control maintains ±0.1°C stability, preventing thermal drift that degrades measurement precision.
Data validation means checking results against known standards and assessing reproducibility. Run the same sample three times. Do you get consistent results?
Practical Lab Workflow Integration and Troubleshooting
Integrating particle metrology into your lab’s routine means building workflows that catch errors before they propagate through your data. The difference between labs that produce reliable measurements and those that generate noise is not the equipment, it’s the systematic approach to error detection and prevention.
Building a Daily Pre-Measurement Checklist
Before you measure a single sample, establish a pre-measurement protocol that takes 15-20 minutes and prevents 80% of common errors:
Environmental checks (5 minutes):
- Verify room temperature is within ±2°C of your instrument’s operating range (typically 20-25°C). Temperature drift shifts optical properties and detector response.
- Check humidity is between 30-70% relative humidity. Condensation on optical surfaces or desiccant saturation in the instrument degrades measurement quality.
- Confirm the instrument has been powered on for at least 30 minutes (allows thermal stabilization of the laser and detectors).
Optical path inspection (5 minutes):
- Visually inspect the optical cell or cuvette for dust, residue, or cloudiness. Dust or residue on optical surfaces scatters stray light, inflating measured particle counts or distorting size distributions.
- If contamination is visible, clean the optical path with lens paper and appropriate solvents (typically 70% ethanol for aqueous systems, or the solvent recommended by your instrument manufacturer).
- Maintain a log of cleaning dates. If you’re cleaning more than once per week, your lab environment may have excessive dust, consider upgrading to a cleanroom or installing air filtration.
Calibration verification (5 minutes):
- Measure your calibration standard (the same reference material you use for quarterly calibration). This takes 2-3 minutes.
- Compare the result to the baseline value from your last calibration event. If the result is within ±3% of baseline, proceed with sample measurement. If it exceeds ±3%, investigate before measuring samples.
- If calibration verification fails, check for obvious issues: Is the optical cell clean? Is the instrument at thermal equilibrium? Is the calibration standard stored correctly (protected from light, temperature extremes, and contamination)? If you cannot identify the issue, contact your instrument manufacturer or calibration service.
This 15-minute protocol catches 80% of measurement errors before they corrupt your data. Labs that skip this step inevitably discover, weeks later, that their data was systematically biased or that optical contamination inflated their particle counts.
Systematic Troubleshooting Workflow for Common Measurement Errors
Error 1: Calibration standard measures outside specification (>±3% of baseline).
Root causes: Optical contamination, thermal drift, detector aging, or instrument malfunction.
Diagnostic workflow:
- Clean the optical cell and re-measure the calibration standard. If the result returns to specification, the issue was contamination, document the cleaning and proceed.
- If the result remains out of specification, wait 30 minutes for thermal equilibration and re-measure. If the result returns to specification, the issue was thermal drift, confirm the room temperature is stable and proceed.
- If the result remains out of specification after cleaning and thermal stabilization, the instrument requires service. Do not measure samples. Contact your instrument manufacturer or a certified service center.
Diagnostic workflow:
- Verify you’re measuring the correct sample. Check the label and sample preparation notes.
- Measure the sample immediately after fresh sonication (ultrasonic treatment to break up aggregates). If the result shifts toward your expected range, the issue was aggregation, document the sonication time and proceed.
- If the result remains outside range, prepare a dilution series: measure the sample at 1:1, 1:2, 1:5, and 1:10 dilutions. Plot the results. If particle size decreases with dilution, the issue is particle-particle interactions at high concentration (the sample was too concentrated for accurate measurement). If particle size remains constant across dilutions, the issue is not concentration, investigate sample preparation or material composition.
- If the sample was prepared from a stock solution, re-measure the stock solution. If the stock measures at your expected size, the issue is in your dilution procedure (incorrect volume, contamination, or aggregation during dilution). If the stock also measures outside range, the issue may be in the original material or sample storage.
Prevention: Measure samples immediately after preparation. Use temperature-controlled measurement cells.
Diagnostic workflow:
- Check the sample concentration. Most DLS instruments operate optimally in the 0.1-100 mg/mL range. If your sample is outside this range, dilute (if too concentrated) or concentrate (if too dilute) and re-measure. Poor repeatability often disappears when concentration is corrected.
- Measure the sample three more times, waiting 2 minutes between measurements. If repeatability improves, the issue was sample instability (aggregation or settling). Reduce the time between measurements or use a stirred measurement cell.
- Check room temperature and humidity. If either has drifted >2°C or >10% relative humidity since your pre-measurement checks, allow the instrument to re-equilibrate and re-measure.
- If repeatability remains poor after these checks, the sample may be genuinely unstable (particles aggregating or settling during measurement). This is valid data, it indicates your sample requires stabilization (surfactant, pH adjustment, or different solvent).
Prevention: Measure samples within 5 minutes of preparation. Use temperature-controlled cells.
Error 4: Particle count is unexpectedly high or low.
Root causes: Optical contamination, concentration outside the linear range, or aggregation.
Diagnostic workflow:
- Clean the optical path and re-measure. If the count returns to expected levels, the issue was contamination.
- Prepare a dilution series (1:1, 1:2, 1:5, 1:10) and measure each. Plot particle count vs. dilution factor. If the count scales linearly with dilution (e.g., 1:2 dilution gives half the count), your original sample was too concentrated and particle-particle interactions were distorting the count. If the count does not scale linearly, the issue may be aggregation or settling.
- Measure the sample immediately after fresh sonication. If the count increases, aggregation was present, adjust your sample preparation procedure.
Prevention: Maintain optical cleanliness. Verify sample concentration is within the instrument’s linear range.
Sample Preparation Standard Operating Procedure
Measurement errors often originate in sample preparation, not the instrument. Establish a written SOP that every lab member follows:
-
Material receipt and storage: Document the date, source, and initial appearance of the material. Store in a dark, temperature-controlled location (typically 4-25°C, depending on material stability). Protect from light, air oxidation, and contamination.
-
Suspension preparation: Weigh or volume-measure the material according to your target concentration. Use ultrapure water or the appropriate solvent (document which solvent you use, different solvents may affect particle size). Sonicate for 5-10 minutes (document the sonication time and power level). Allow the suspension to cool to room temperature before measurement.
-
Dilution (if needed): If your suspension is too concentrated, prepare dilutions using the same solvent. Use calibrated pipettes and volumetric flasks. Prepare dilutions fresh; do not store diluted suspensions for more than 1-2 hours before measurement.
-
Measurement timing: Measure within 5 minutes of preparation. If you cannot measure immediately, store the suspension at room temperature in a sealed container, protected from light.
-
Documentation: Record the material lot number, preparation date and time, solvent used, sonication parameters, dilution factor (if any), and measurement results. This documentation is essential for troubleshooting and regulatory compliance.
Software Automation and Real-Time Data Management
Modern particle metrology instruments generate enormous datasets. Manual transcription and analysis are error-prone and time-consuming.
Key automation features to implement:
Real-time out-of-specification alerts: Configure your LIMS or data management software to flag any measurement that exceeds your acceptable tolerance (e.g., particle size >110 nanometers when your specification is 100 ± 10 nanometers). Alerts trigger immediate investigation rather than discovering the problem during batch review.
Automated re-measurement protocols: If a measurement fails specification, the system can automatically trigger a re-measurement of the same sample.
Calibration tracking: Automated reminders for calibration due dates.
Audit trail: Every measurement, calibration, and data modification is logged with timestamp, user ID, and reason.
Statistical summaries: Automated generation of mean, standard deviation, and distribution plots for each sample batch.
The benefit extends beyond convenience.
The labs that produce the most reliable particle metrology data are not those with the most expensive instruments, they’re the labs with the most disciplined workflows. A 15-minute pre-measurement checklist, systematic troubleshooting procedures, and automated data validation prevent 80% of measurement errors. Invest in process discipline, not just equipment.
Frequently Asked Questions
What is the importance of particle metrology in nanotechnology?
Particle metrology directly determines whether nanomaterials perform as designed. Size-dependent properties, toxicity, reactivity, optical behavior, change dramatically at the nanometer scale. Accurate measurement of particle size distribution ensures that manufactured nanoparticles meet specification, enabling reproducible results in research and manufacturing. Without precise particle metrology, labs cannot validate that their nanomaterials are safe, effective, or consistent batch-to-batch.
How do you calibrate instruments for nanoparticle measurement?
Calibration requires certified reference materials and metrological traceability to national standards. Calibration wafer standards for metrology serve as the baseline for semiconductor and nanotech labs. Most labs use particle size standards with known distributions, then verify instrument output against these references. Calibration ensures measurement uncertainty stays within acceptable limits. Recalibration frequency depends on instrument type and regulatory requirements, typically quarterly for active labs.
What are the primary challenges in nanoscale particle detection?
The primary challenges include measurement uncertainty at single-nanometer scales, suspension stability during analysis, and ensuring statistical significance with limited sample sizes. Dynamic light scattering lacks sensitivity below 1 nanometer, while electron microscopy requires extensive sample preparation. High-throughput counting of hundreds or thousands of particles is needed for accurate distribution analysis, adding complexity and time.
How does particle metrology impact semiconductor manufacturing yields?
Contaminant particle size directly affects semiconductor yield. Sub-10nm particles can cause defects in advanced nodes (5nm and below), while larger particles affect earlier-generation production. Precise particle metrology enables manufacturers to identify contamination sources, validate cleanroom performance, and adjust process parameters before yield loss occurs. Real-time particle monitoring and accurate size distribution analysis reduce scrap, rework, and downtime. Semiconductor contamination control standards require documented particle measurement protocols and regular validation.
