
Ultrasonic vs. Liquid Nitrogen Fog for Pharmaceutical Smoke Studies
Neutral buoyancy is a tracer-performance question—not merely a fog-generation label. This technical overview explains the physics behind ultrasonic water fog and liquid-nitrogen (LN₂) fog, current FDA smoke-study expectations, and how Applied Physics CRF Series and AP Series foggers fit into a defensible airflow-visualization program.
Airflow Visualization Is About Tracer Fidelity
Airflow visualization studies—often called smoke studies—are used to evaluate airflow direction, continuity, recovery, turbulence, wake behavior, dead zones, first-air protection, and the effects of equipment and operator interventions in cleanrooms, isolators, RABS, biosafety cabinets, filling lines, and other controlled environments.
The objective is not simply to create visible fog. The objective is to introduce a visible tracer that follows the air closely enough that the observer can evaluate the airflow itself without the tracer materially creating, masking, or departing from the flow pattern being studied.
FDA’s 2026 warning letters to pharmaceutical manufacturers specifically emphasize thorough smoke studies under dynamic conditions and cite “neutrally buoyant media” as an example of proper practice. FDA: Wizcure Pharmaa, June 24, 2026 and FDA: International Medication Systems, July 2, 2026.
What Does “Neutrally Buoyant” Mean for a Smoke Study?
A microscopic liquid-water droplet does not literally have the same material density as air. In airflow visualization, the more useful scientific question is whether the tracer remains sufficiently coupled to the airflow that gravitational settling, particle inertia, thermal effects, and source momentum are small relative to the airflow being evaluated during the observation interval.
Functional neutral buoyancy: a tracer condition in which gravitational, inertial, and thermal deviations are sufficiently small relative to the airflow being visualized that the tracer faithfully represents the direction, continuity, and relevant structures of that airflow during the observation interval.
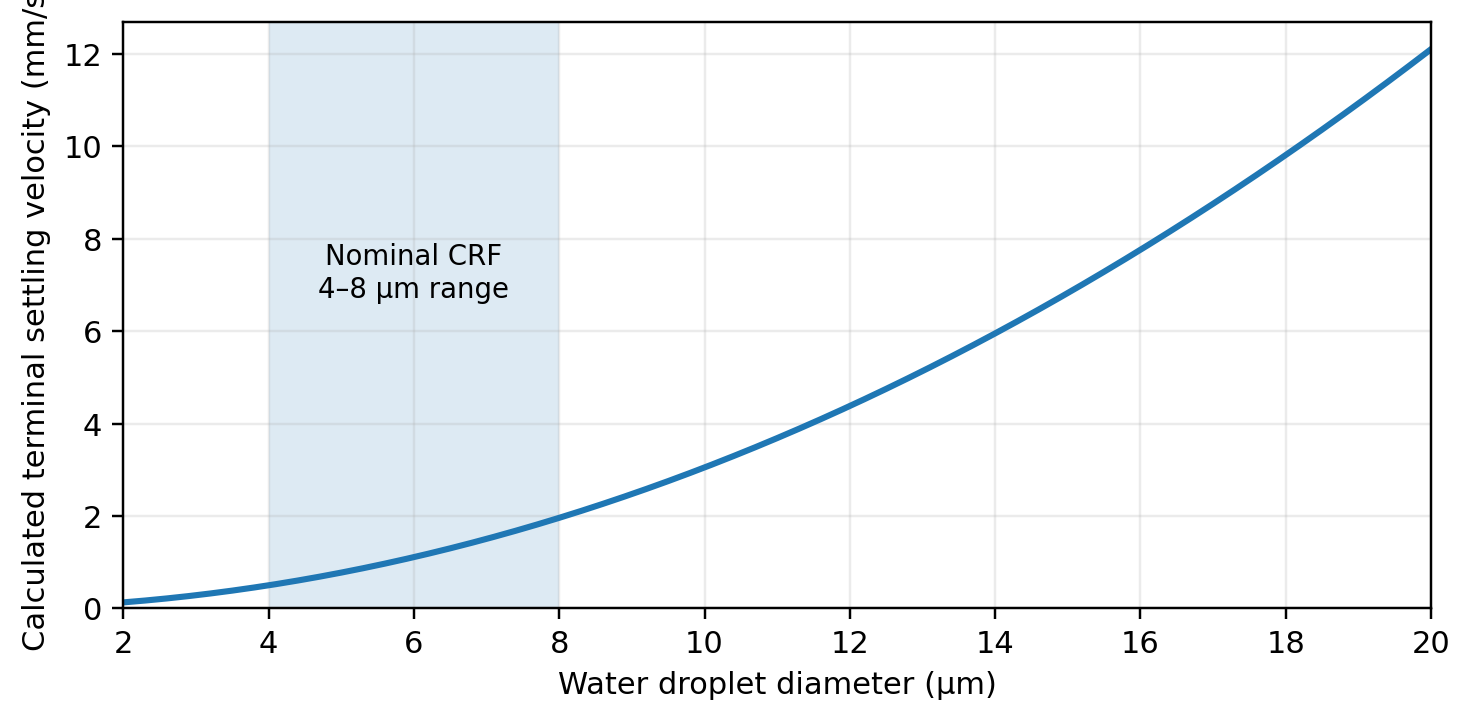
Particle relaxation time, gravitational settling velocity, and Stokes number are established tools for evaluating whether particles can behave as airflow tracers. Smaller droplets generally respond more rapidly to changes in gas velocity and exhibit lower gravitational settling rates.
Ultrasonic Water Fog: CRF Series
Applied Physics CRF Series foggers use high-frequency piezoelectric atomization to generate micron-scale water fog from DI, sterile, or WFI water. Ultrasonic atomization creates fog without boiling the water and can generate droplets small enough to behave as passive airflow tracers when the complete fog-delivery system is appropriately qualified.
Peer-reviewed literature directly supports the use of ultrasonic water fog for airflow visualization. D. A. Kennedy reported that water fog produced by an ultrasonic nebulizer was suitable for airflow visualization and demonstrated the airflow features visualized by conventional mineral-oil smoke.
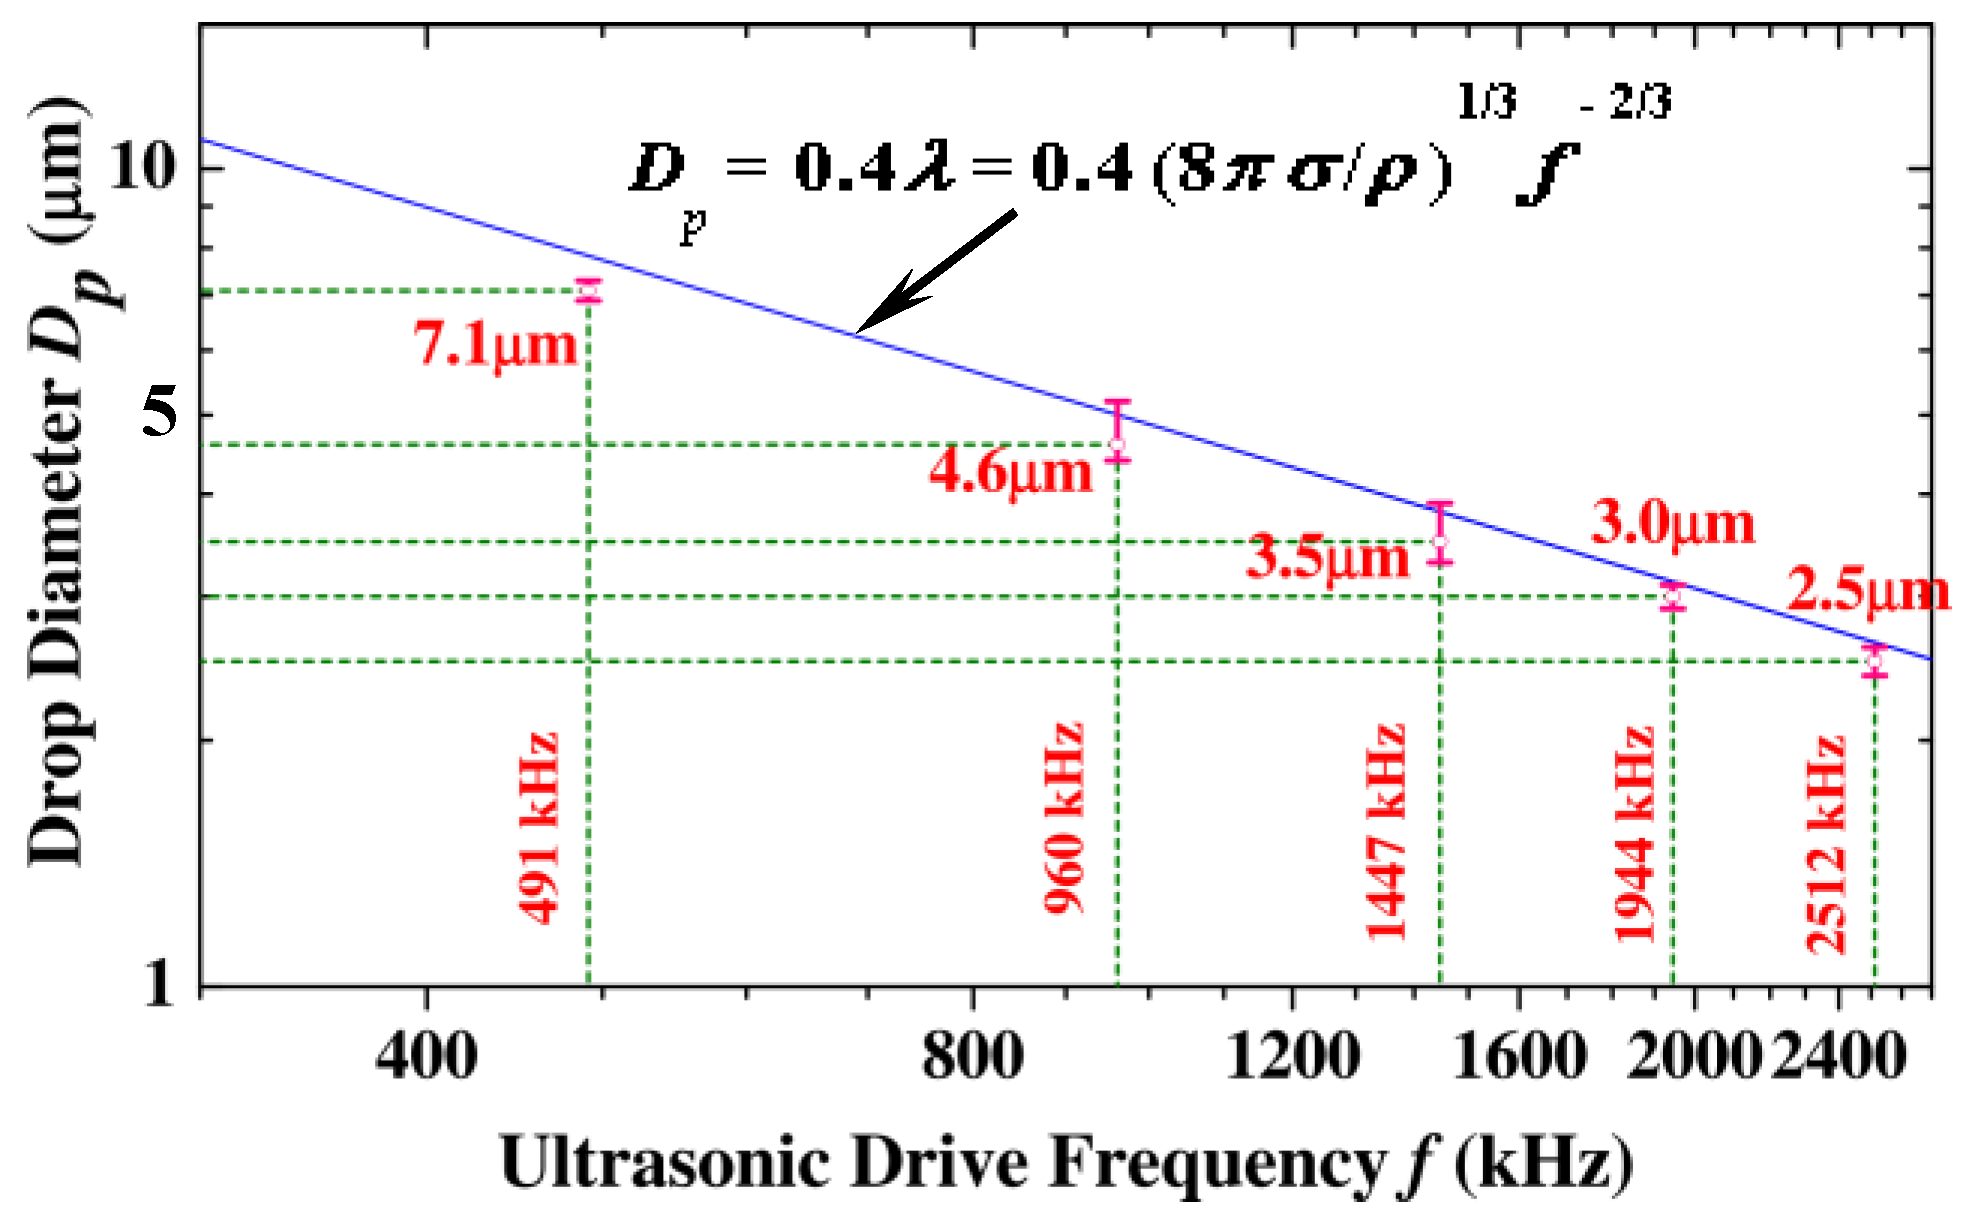
A later peer-reviewed study developed a high-flow ultrasonic seeder using twelve piezoceramic disks oscillating at 1.65 MHz. The device generated water droplets with a 4–5 µm Sauter mean diameter and successfully seeded a free-air jet for three-dimensional velocity measurements using stereoscopic particle image velocimetry (PIV).
Kennedy, Water Fog as a Medium for Visualization of Airflows
High flow-rate ultrasonic seeder, Flow Measurement and Instrumentation (2014)
Why Coalescence and Fog Age Matter
Freshly generated micron-scale droplets provide the strongest aerodynamic case. As a fog cloud ages, droplets may evaporate, collide, or coalesce. Coalescence increases effective droplet diameter, and larger droplets generally settle more rapidly. For that reason, airflow visualization should be based on freshly generated tracer fog in the region being studied rather than assuming an aged cloud retains its original size distribution indefinitely.
Sauter Mean Diameter (D32) is a statistical way to describe a droplet population; it is not a physical “Sauter limit” that droplets grow toward.
Liquid Nitrogen Fog: AP Series
Applied Physics AP Series LN₂ foggers provide a second airflow-visualization platform for customers that prefer or require cryogenic fog. The visible cloud is condensed water fog produced through the interaction of liquid nitrogen, controlled water vapor, and the surrounding gas stream.
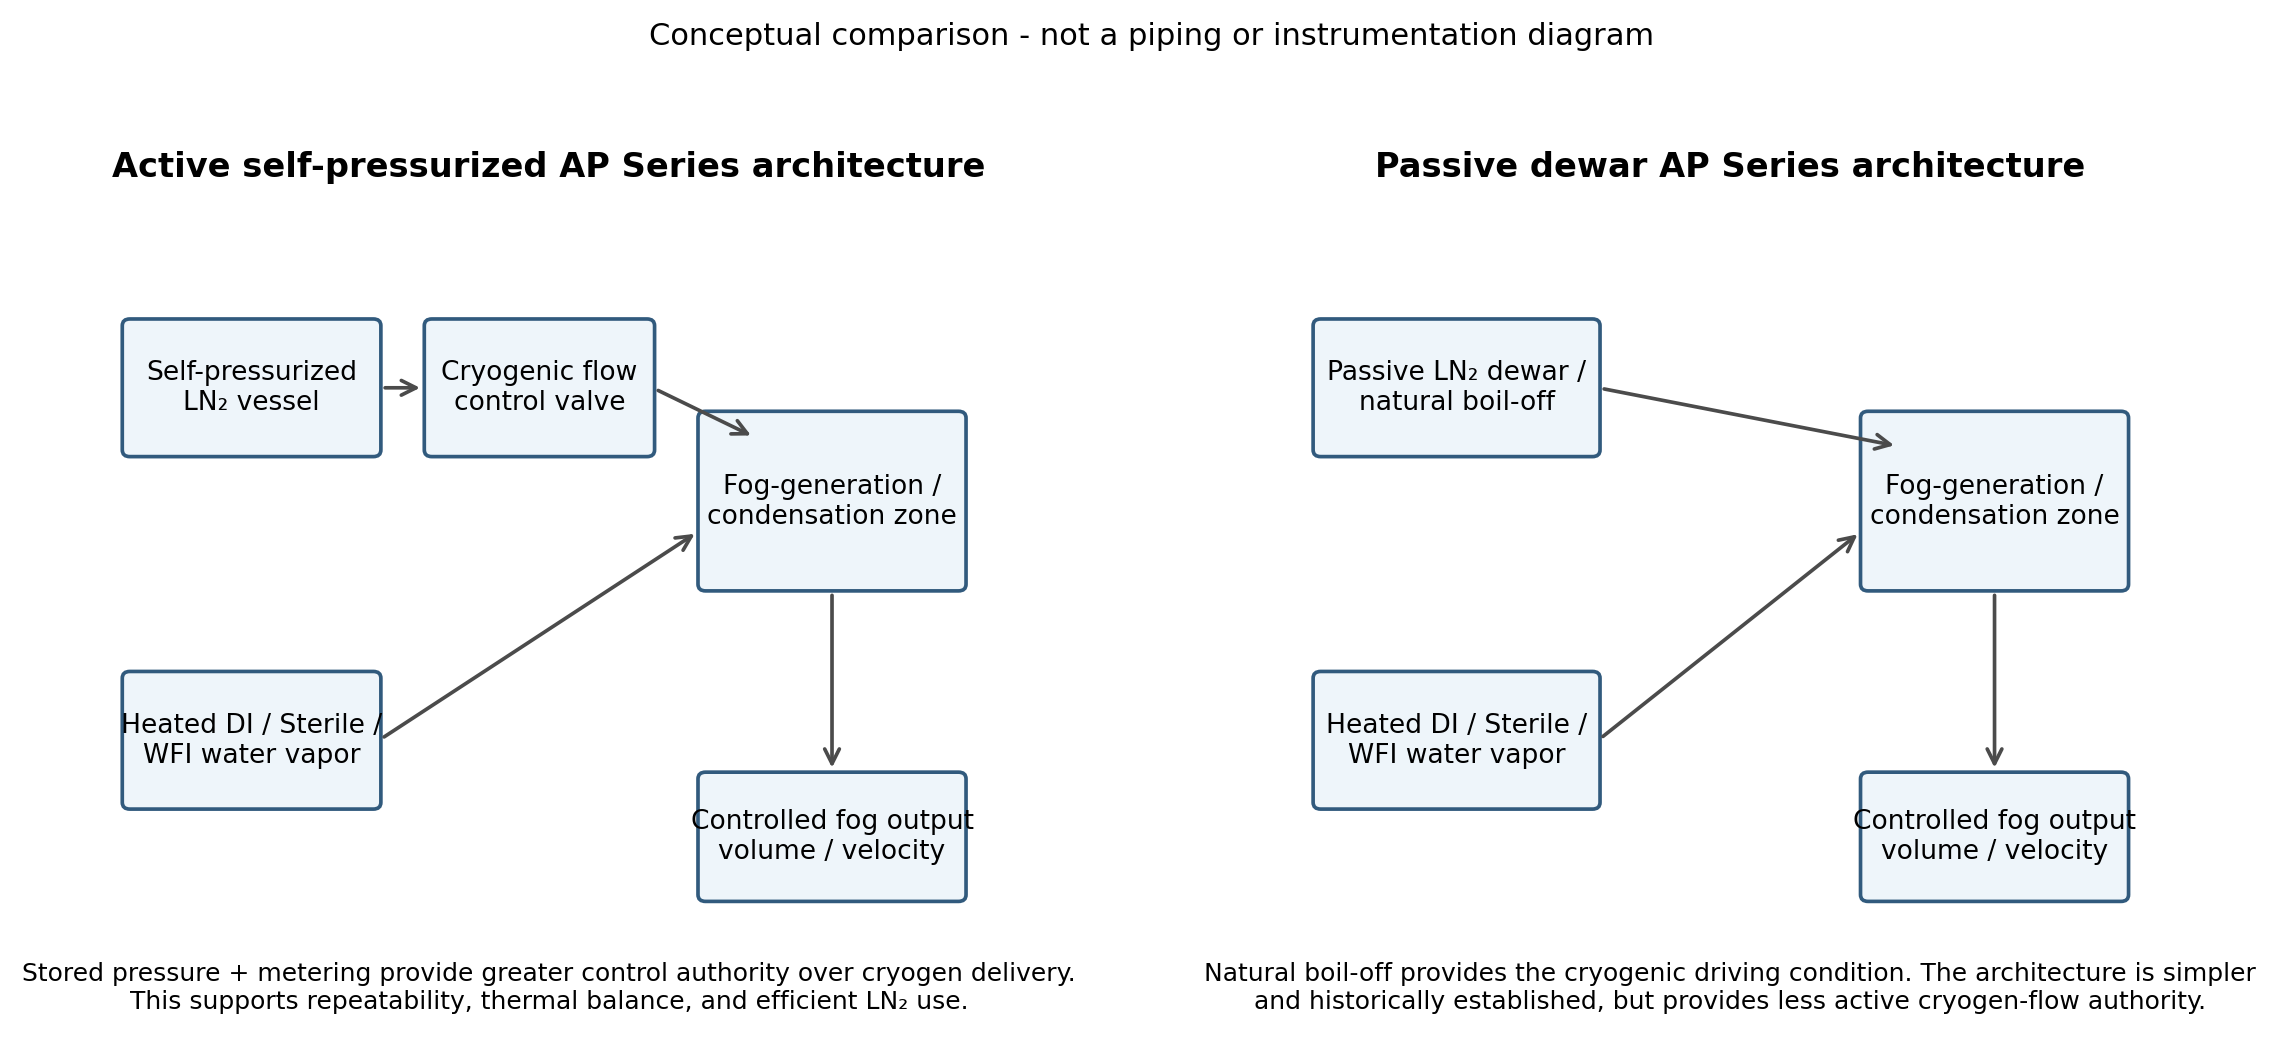
The AP Series includes both active self-pressurized architectures and passive dewar-style architectures. The technologies serve the same general purpose but manage cryogenic delivery differently.
Self-Pressurized LN₂ Systems: Why Control Valves Matter
In an active self-pressurized architecture, stored pressure and metered cryogenic delivery give the fogger greater control authority over the LN₂ entering the fog-generation process. Applied Physics uses control valves so the system can regulate cryogenic flow rather than simply accepting whatever flow is produced by a passive source.
That control can improve performance in three ways:
The goal is not maximum LN₂ discharge. The goal is stable, visible tracer generation at the output required by the study. Active control makes LN₂ delivery a managed process variable.
Dewar-Style LN₂ Systems
Passive dewar-style AP Series systems use the natural boil-off behavior and pressure developed within the LN₂ vessel as the cryogenic driving condition. This architecture is mechanically simpler and historically established, and it remains useful for facilities that already work extensively with dewars or prefer a passive cryogenic supply strategy.
Examples in the current AP Series portfolio include the AP95 and AP175. Self-pressurized and dewar-style systems should not be reduced to “good” versus “bad”; they provide different levels of active flow authority, complexity, and operating flexibility.
Ultrasonic or LN₂: Which Is Better?
There is no scientifically sound basis for reducing the decision to “LN₂ is compliant and ultrasonic is not.” The more useful question is whether the selected tracer faithfully visualizes the airflow under the actual study conditions.
| Consideration | CRF Ultrasonic | AP Series LN₂ |
|---|---|---|
| Consumable | DI / sterile / WFI water | LN₂ + DI / sterile / WFI water |
| Fog-generation method | MHz piezoelectric atomization | Cryogenic condensation |
| Operational simplicity | No cryogenic handling | Requires LN₂ procedures and supply |
| Fog volume / visual density | Model dependent | Well suited to high-volume applications |
| Best regulatory argument | Tracer fidelity supported by particle physics, literature, and qualification | Established cryogenic tracer platform plus site-specific study execution |
| Primary selection driver | Application, study design, site SOP, airflow scale, required visibility, and documented tracer performance | |
The Smoke Study Is More Than the Fogger
Even an excellent tracer can produce a poor airflow visualization study. FDA’s current enforcement emphasis includes dynamic operating conditions, operator interventions, source positioning, visibility, equipment configuration, and complete evaluation of unidirectional airflow. The fogger should support the study—not become a substitute for study design.
- Use representative dynamic operating conditions.
- Evaluate relevant interventions, obstructions, and operator interactions.
- Position and move the fog source without materially disturbing the airflow.
- Maintain sufficient visual contrast and camera positioning to document the airflow.
- Use freshly generated tracer fog in the region of interest.
- Retain site-specific SOP, qualification, and executed-study evidence.
Applied Physics Technical Documentation
The following manufacturer documents are available for pharmaceutical validation, quality, engineering, and regulatory teams. The detailed qualification protocols and site-use frameworks are available from Applied Physics upon request.
Frequently Asked Questions
Does FDA prohibit ultrasonic foggers for pharmaceutical smoke studies?
The FDA warning letters cited on this page call for proper smoke-study practices and use “neutrally buoyant media” as an example, but they do not specify that ultrasonic atomization is categorically prohibited. Suitability depends on tracer behavior and the execution of the study.
Can ultrasonic water fog follow airflow?
Yes, peer-reviewed literature has directly used ultrasonic water fog for airflow visualization. Other research has used 1.65 MHz ultrasonic atomization to generate approximately 4–5 µm water droplets and successfully measure three-dimensional gas velocity using stereoscopic PIV.
Why does droplet size matter?
Particle inertia and gravitational settling decrease as droplet diameter becomes smaller. Micron-scale droplets can therefore remain strongly coupled to moving air over the observation interval, although temperature, source momentum, humidity, evaporation, and coalescence must also be considered.
Why use a self-pressurized LN₂ fogger?
Self-pressurization combined with cryogenic flow-control valves gives the system greater control over LN₂ delivery. This can improve repeatability, allow fog output to be matched to the application, and reduce unnecessary cryogen consumption.
Why would a facility choose a dewar-style LN₂ fogger?
Dewar-style systems use a passive, established LN₂ supply architecture with fewer active cryogenic-control components. They remain useful where the facility prefers dewar operation, already has cryogenic procedures in place, or values the simplicity of a passive supply approach.
Need Help Selecting or Supporting an Airflow Visualization Method?
Applied Physics supports pharmaceutical manufacturers, validation engineers, commissioning teams, cleanroom professionals, semiconductor manufacturers, laboratories, and controlled-environment facilities with CRF Series ultrasonic foggers and AP Series LN₂ systems.
Selected Scientific & Regulatory References
- D. A. Kennedy. “Water Fog as a Medium for Visualization of Airflows.” The Annals of Occupational Hygiene, 31(2), 255–259 (1987). Source.
- “High flow-rate ultrasonic seeder.” Flow Measurement and Instrumentation, Volume 38, 62–66 (2014). Source.
- “Faraday Waves-Based Integrated Ultrasonic Micro-Droplet Generator and Applications.” Micromachines 8(2), 56 (2017). Source.
- U.S. FDA. Wizcure Pharmaa Private Limited Warning Letter, June 24, 2026. Source.
- U.S. FDA. International Medication Systems Limited Warning Letter, July 2, 2026. Source.
This article provides technical and scientific information regarding airflow-tracer technologies. Site-specific acceptance depends on the equipment configuration, qualification strategy, SOPs, study execution, and applicable regulatory requirements.