
Last Updated: August 18, 2026
Alternatives to traditional particle counters have become critical for facilities facing pressure to reduce validation downtime while maintaining regulatory compliance. Traditional optical particle counters require periodic sampling, produce data only after incubation, and demand significant setup and calibration time before each use. Leading operations are adopting hybrid strategies that combine real-time aerosol monitoring, biofluorescent detection, and airflow visualization to gain continuous insight without downtime penalties. The alternatives available today address specific pain points: speed of results, continuous monitoring capability, validation flexibility, and total cost of ownership.
Biofluorescent detection represents the most direct alternative to traditional viable plate counting. Instead of waiting 24-48 hours for microbial colonies to grow, biofluorescent counters identify viable cells in real time by detecting their natural fluorescence or by staining them with fluorescent markers. This approach eliminates incubation delay while maintaining the ability to distinguish viable from non-viable particles.
Biofluorescent particle counters use optical sensors to detect autofluorescence in microbial cells or apply fluorescent dyes that bind specifically to viable organisms. When cells are exposed to excitation light at specific wavelengths, viable cells emit detectable fluorescence. The system counts these signals in real time, producing microbial concentration data within minutes rather than days. Non-viable particles and inert contaminants do not fluoresce under the same conditions, allowing automatic discrimination between viable and non-viable particles, essential for regulatory compliance.
Biofluorescent detection excels at identifying viable microbial contamination but has limitations compared to optical particle counters. Traditional optical counters detect all particles across a wider dynamic range and at smaller particle sizes (down to 0.1 micrometers). Biofluorescent systems are optimized for viable cell detection and may miss non-viable particles.
The practical trade-off depends on your regulatory requirement. If your facility must demonstrate viable contamination control (as in USP 797/800 compounding pharmacies), biofluorescent detection provides faster, actionable data. If you need comprehensive particle size distribution data for HEPA filter validation or semiconductor cleanroom certification, traditional optical counting or real-time aerosol monitoring becomes necessary. Many facilities use biofluorescent detection for routine environmental monitoring while maintaining optical counting for periodic comprehensive validation.
Pro Tip Biofluorescent detection is fastest when you need viable cell counts for rapid decision-making. Deploy it for routine environmental monitoring in pharmaceutical facilities, then confirm results with traditional methods during formal validation audits.
Real-time aerosol monitoring systems use light scattering technology to detect and count particles continuously, without sampling intervals or incubation delays. Unlike traditional optical particle counters that require manual sampling at discrete points, real-time systems can remain permanently installed in cleanroom environments, providing continuous data streams that reveal contamination events as they occur.
Real-time aerosol monitors work by drawing air through a chamber where particles scatter laser light. Sensors detect this scattered light and convert it to particle count data. Modern systems achieve dynamic ranges from 0.3 micrometers to 100 micrometers, covering the particle sizes most relevant to cleanroom contamination control. For semiconductor fabrication, where sub-10nm contamination can cause yield loss, real-time aerosol monitoring provides continuous oversight even though it cannot directly measure individual nanoparticles; it detects agglomerated clusters that form when nanoparticles accumulate.
Continuous real-time monitoring reveals contamination patterns that periodic sampling misses. A traditional optical counter might sample a cleanroom once per shift, capturing a single data point. A real-time system logs data every second, showing when contamination spikes occur, how long it persists, and whether your HVAC system responds appropriately. This continuous visibility enables faster corrective action and provides evidence of control that regulators expect.
The downside is data volume. Continuous monitoring generates thousands of data points daily, requiring automated data management and analysis. Periodic sampling remains valuable for targeted validation, you can position a traditional optical counter at specific risk points during critical operations, then remove it when validation is complete.
Key Takeaway Real-time aerosol monitoring excels at detecting when contamination occurs and how your facility responds. Periodic optical sampling remains the gold standard for formal validation and regulatory documentation.
Airflow visualization using smoke tracers or aerosol generators reveals how air actually moves through your cleanroom, information that particle counts alone cannot provide. A cleanroom might show acceptable particle levels while airflow patterns create dead zones or short-circuit paths that bypass critical work areas.
Smoke studies use visible aerosol tracers (typically diethyl phthalate or PAO fog) to show airflow direction and velocity in real time. Fog that flows smoothly from supply to exhaust indicates proper design. Fog that stalls, swirls, or reverses direction indicates problems: blocked vents, thermal gradients, or equipment placement that disrupts laminar flow.
Applied Physics aerosol generators, such as the BAG-4B and BAG-6D models, are purpose-built for these studies.
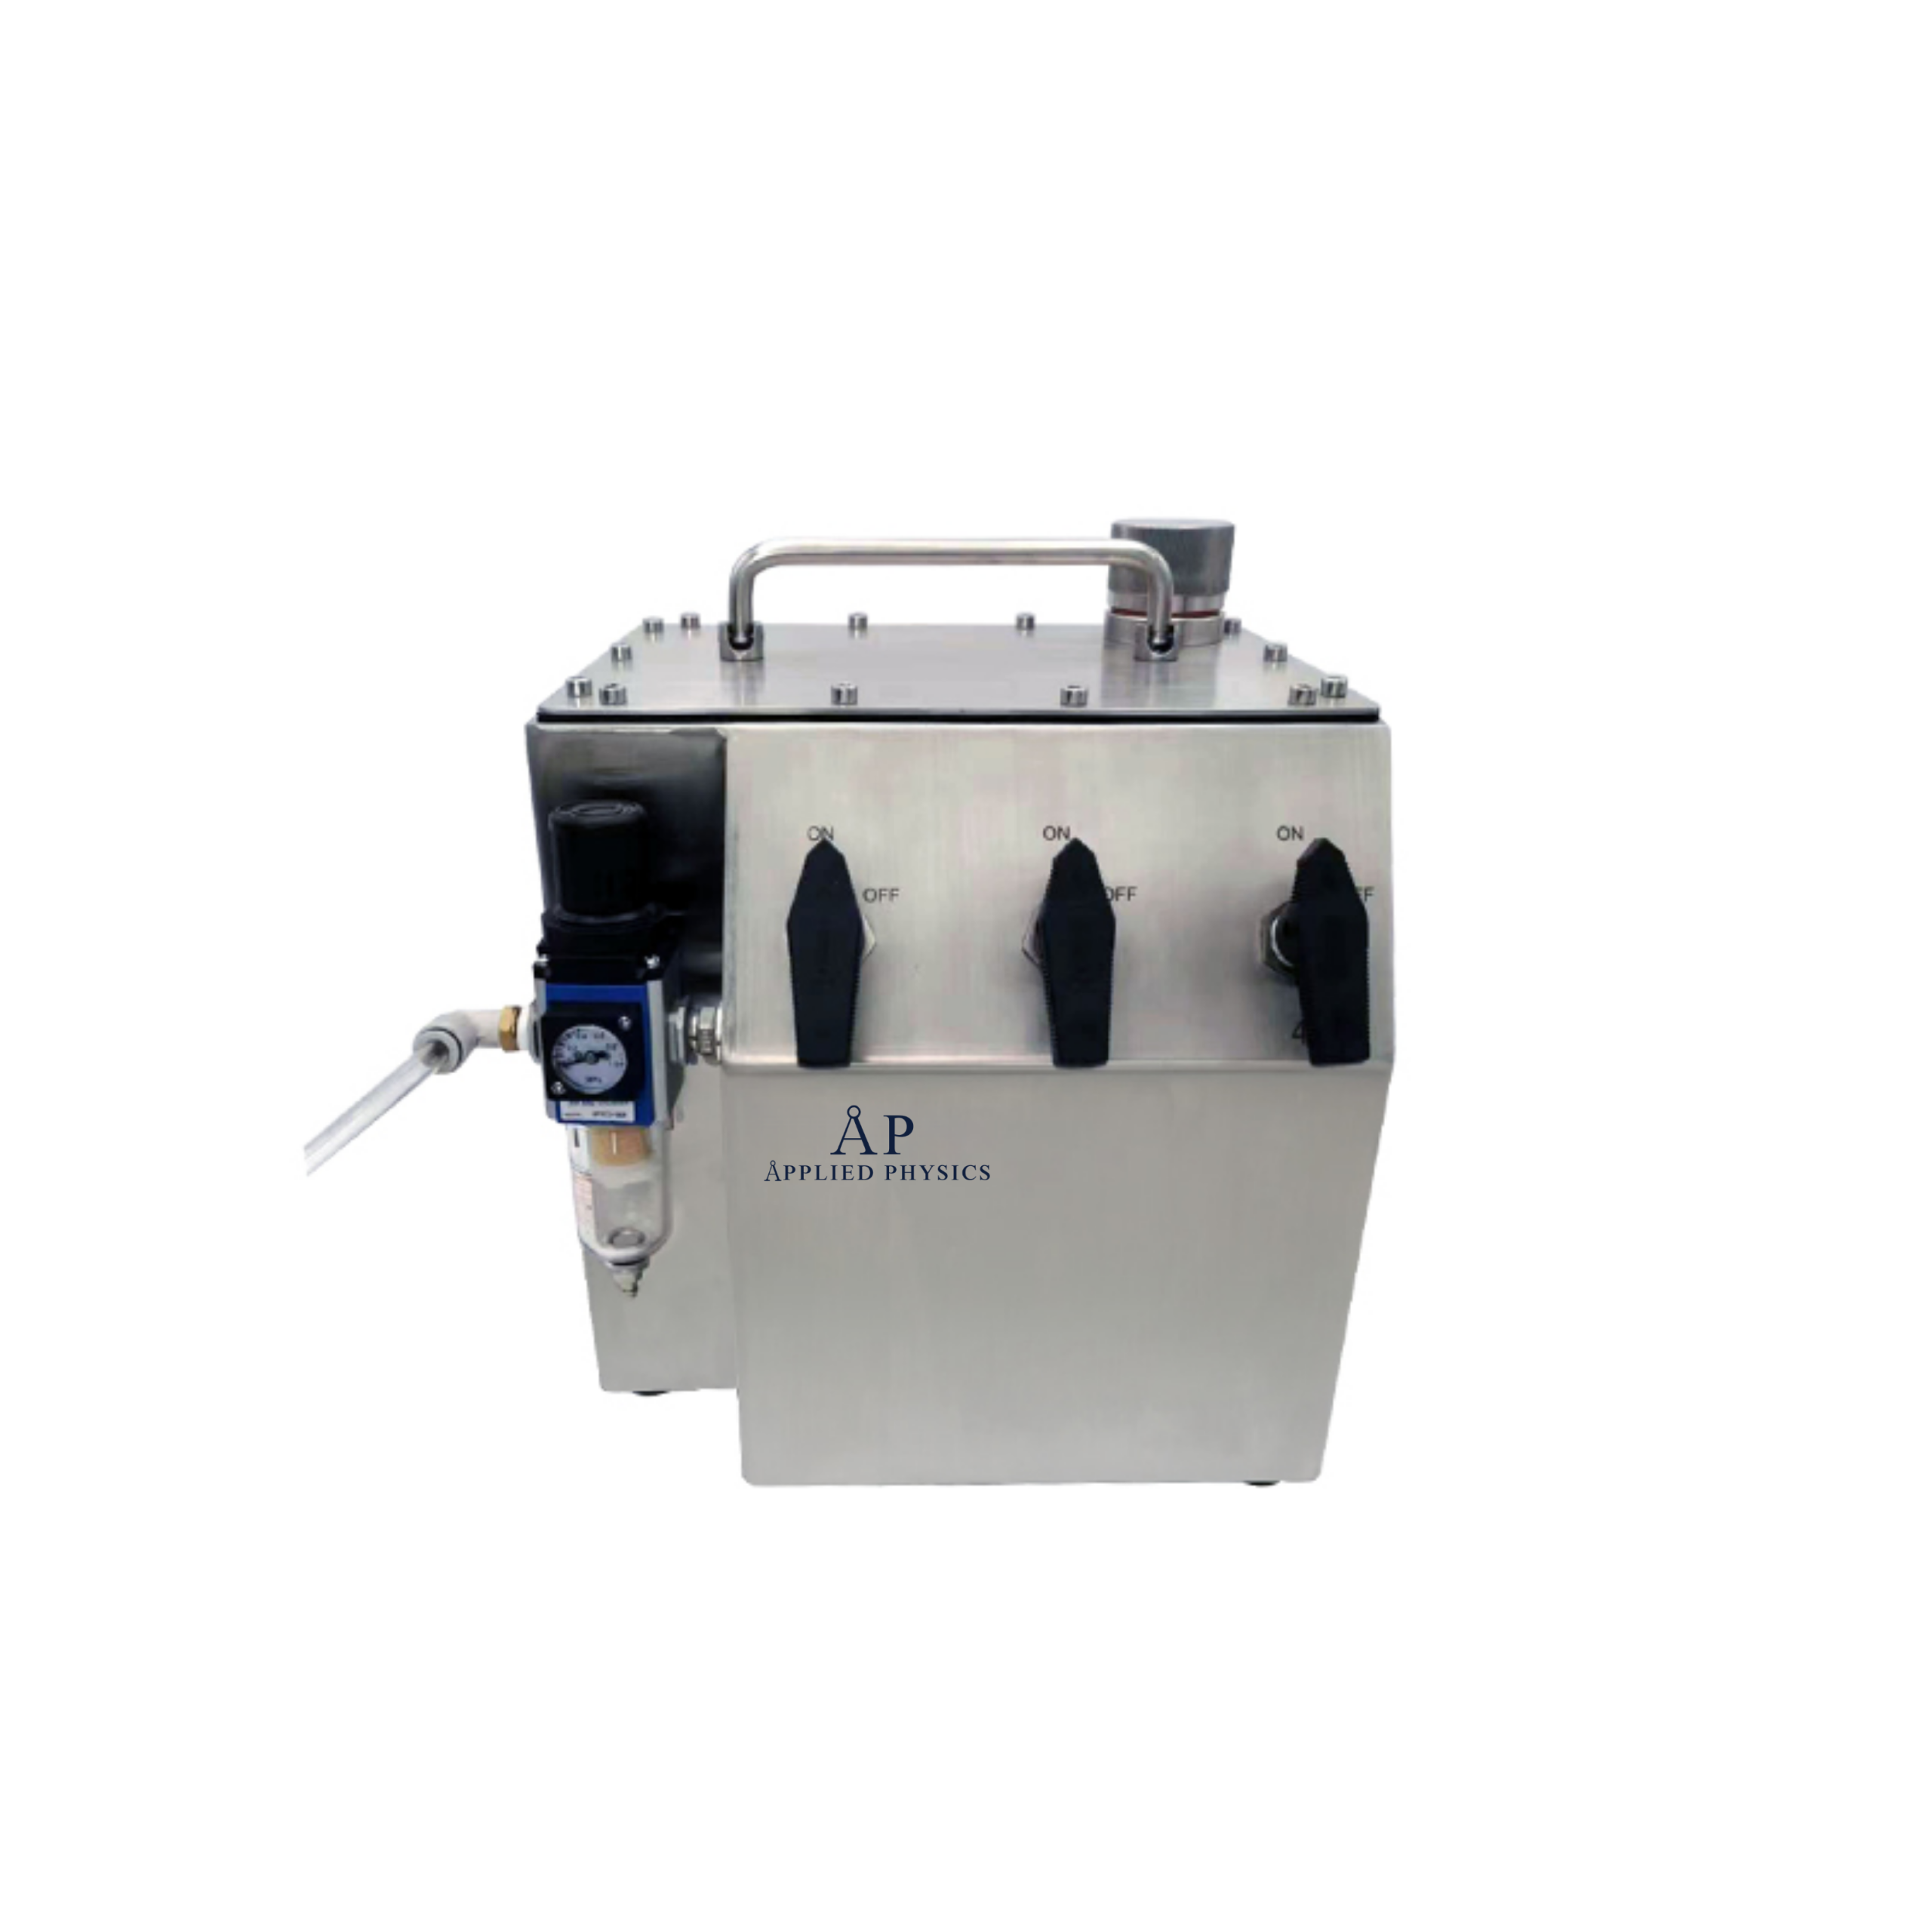
Aerosol Generator-Cold Type BAG-4B
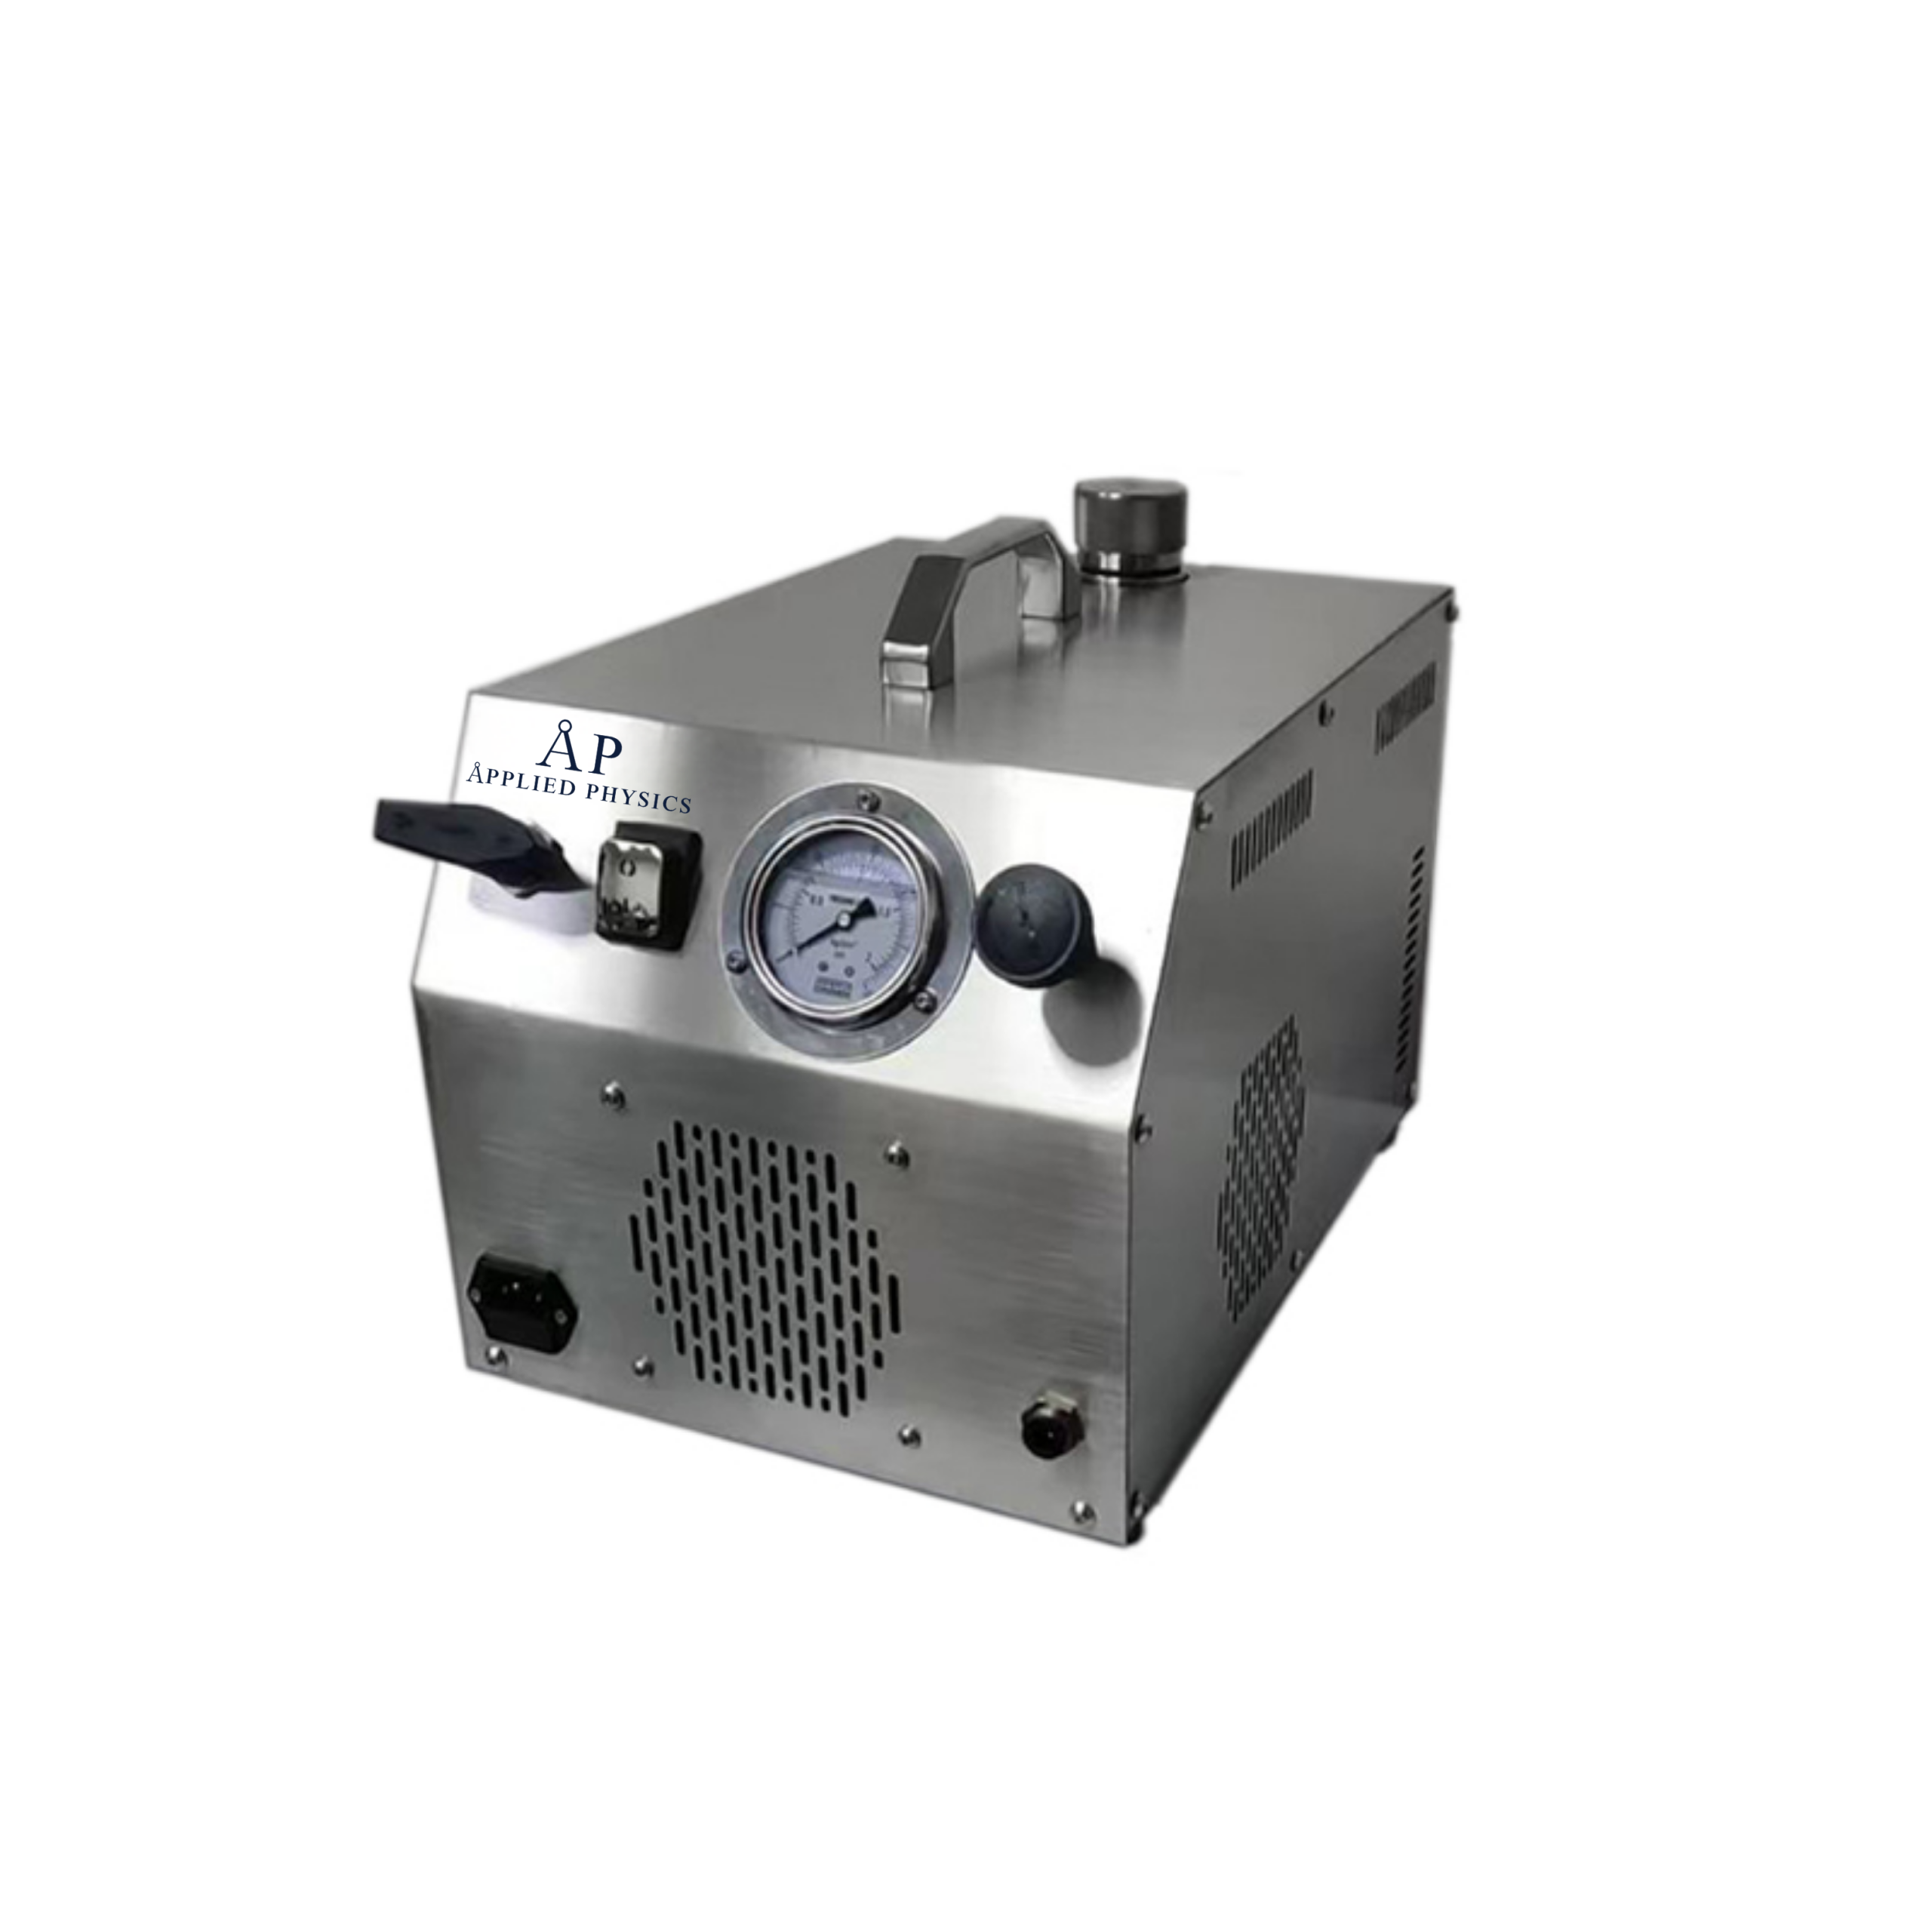
Aerosol Generator-Cold Type BAG-6D
Airflow visualization doesn’t replace particle counting, it complements it. Particle counts tell you whether contamination is present. Airflow visualization tells you why. For new cleanroom qualification or after major HVAC modifications, visualization is essential. Regulators expect documented evidence that airflow patterns support the intended contamination control. Particle counts alone don’t prove this. Visualization studies, combined with velocity measurements and particle data, create the complete picture.
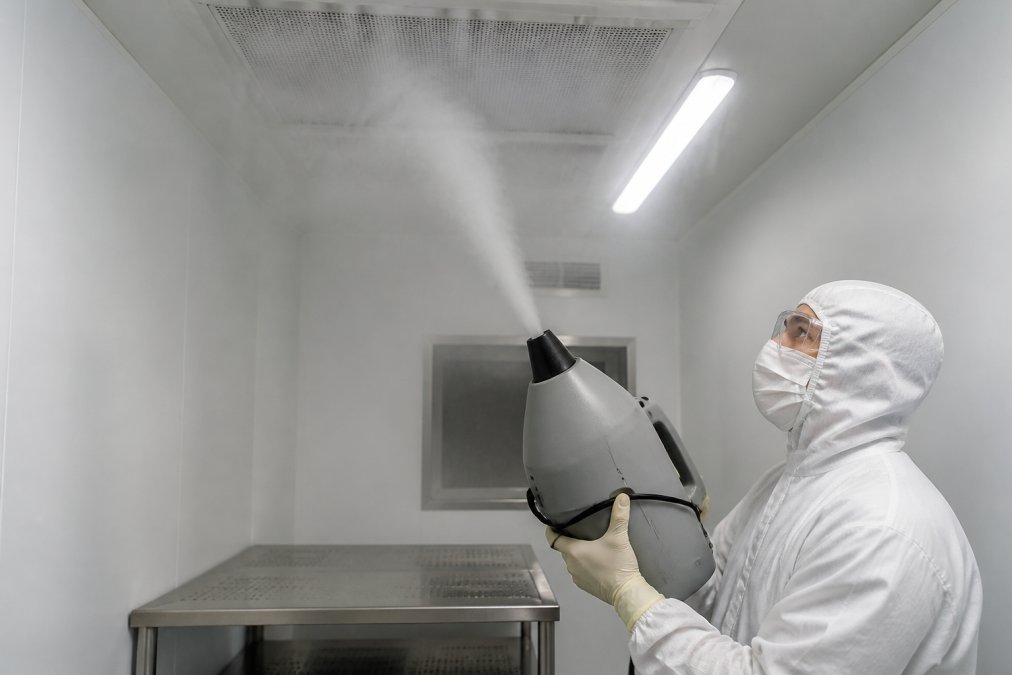
Process engineer releasing visible aerosol tracer into cleanroom environment to observe airflow patterns around work surfaces and HEPA filter returns under bright cleanroom lighting
Calibration wafer standards provide traceable reference particles for validating that your particle detection systems are accurate. In semiconductor fabrication, where sub-10nm contamination can destroy yield, confidence in your measurement system is non-negotiable.
Semiconductor-grade calibration wafers contain reference particles manufactured to sub-10 nanometer precision. When you run your optical counter against a calibration wafer, the system should report particle counts and size distributions that match the wafer’s specification. If results diverge, your counter needs recalibration or repair. Applied Physics provides calibration wafer standards that enable your facility to demonstrate to auditors that your particle detection systems are validated and under control.
SEMI standards specify how particle detection systems must be validated. ISO 14644 requires documented evidence that your environmental monitoring equipment is accurate. Calibration wafer standards provide this evidence. The validation process is straightforward: you test your optical counter or aerosol monitor against the calibration wafer, document the results, and retain records showing that your equipment meets specification.
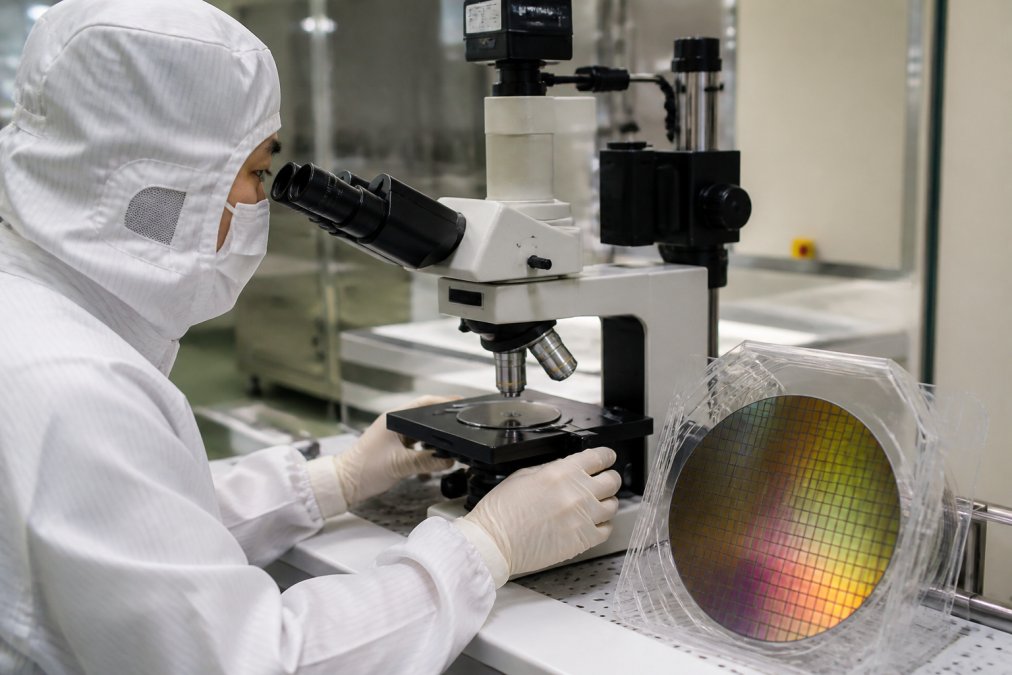
Semiconductor process engineer examining calibration wafer standards under optical microscope in fabrication facility, demonstrating precision measurement setup with proper lighting and magnification
The most sophisticated facilities combine multiple methods into a hybrid strategy. Real-time aerosol monitoring provides continuous oversight. Biofluorescent detection delivers rapid viable cell data. Periodic optical sampling creates formal validation records. Airflow visualization confirms that control strategies are working. Together, these methods provide redundancy, speed, and regulatory defensibility that no single approach can achieve alone.
Real-time systems excel at speed and continuous visibility but require proper data management. Incubation-based methods provide definitive results with established regulatory acceptance. A practical hybrid strategy for a pharmaceutical manufacturing facility might deploy real-time aerosol monitoring in the cleanroom to track particle levels continuously. When the system detects elevated counts, trigger an immediate biofluorescent viable cell assessment. If viable contamination is confirmed, escalate to traditional optical sampling for comprehensive data.
Redundancy ensures that no single equipment failure compromises your contamination control claim. If you have multiple detection methods running in parallel, one failure doesn’t invalidate your entire monitoring program. Data integrity in regulated environments requires documented procedures, calibration records, and audit trails. When you combine multiple monitoring methods, you create a stronger data picture. If real-time data shows elevated counts but optical sampling shows acceptable levels, the discrepancy triggers investigation, which is exactly what you want.
Watch Out Hybrid strategies require more equipment, more training, and more data management than single-method approaches. Deploy them only when regulatory requirements or operational risk justify the additional complexity.
Alternatives to traditional particle counters often carry lower per-measurement costs, but total cost of ownership depends on equipment investment, calibration frequency, maintenance demands, validation downtime, and consumables.
Traditional portable optical particle counters typically cost $15,000-$35,000 per unit, with annual maintenance and calibration running $2,000-$4,000 per year. Real-time aerosol monitoring systems cost $40,000-$80,000 for a single-location installation but eliminate many recurring costs. Biofluorescent detection systems fall in the middle, typically $25,000-$50,000 with lower annual maintenance but higher consumable costs.
Here is a realistic cost breakdown for a mid-sized pharmaceutical facility with two cleanrooms:
Traditional optical counting approach:
Real-time aerosol monitoring approach:
Biofluorescent detection approach:
Real-time systems have higher upfront costs but lower recurring costs, while biofluorescent systems have moderate upfront and recurring costs.
Calibration frequency directly impacts both cost and operational disruption. Traditional optical particle counters require calibration before each use or at minimum weekly, requiring 1-2 hours of technician time per cycle. For a facility running weekly validations, this amounts to roughly 100 hours per year of technician time.
Real-time aerosol monitoring systems require less frequent calibration, typically quarterly or semi-annually, reducing calibration labor from 100 hours/year to roughly 10-15 hours/year. Biofluorescent systems require calibration before each use but the process is faster, typically 15-30 minutes. temperature monitoring alternatives.
Validation downtime is the hidden cost that often justifies switching. If your optical counter requires two hours of setup and calibration before each validation run, and you run validations weekly, you’re investing roughly 100 hours per year in setup alone. Real-time systems eliminate this overhead because they run continuously. For facilities where validation downtime directly impacts production schedules, this efficiency gain justifies the equipment investment.
Quantify your facility’s validation downtime cost by multiplying the number of validation events per year by the hours of downtime per event by your facility’s cost of downtime (typically $500-$2,000 per hour). If you perform 52 validations per year, each requiring two hours of downtime, and your downtime cost is $1,000/hour, your annual downtime cost is $104,000. Real-time monitoring that eliminates this downtime has clear financial justification.
Traditional optical counters require periodic replacement of probe tips, inlet filters, and calibration aerosols, typically $1,000-$2,000 per counter annually. Real-time aerosol monitors require replacement of inlet filters and detection sensors, typically $1,000-$2,000 per year. Biofluorescent systems require fluorescent dyes, culture media, and sample collection supplies, typically $2,000-$4,000 per year depending on sampling frequency.
Over a five-year equipment lifecycle, consumable costs accumulate significantly. A facility with two optical counters might spend $10,000-$20,000 on consumables over five years, while the same facility with real-time monitoring might spend $7,500-$10,000.
Use this framework to calculate the return on investment for switching to an alternative method:
Step 1: Calculate your current annual cost of traditional optical counting (equipment depreciation, maintenance, calibration, consumables, and technician labor).
Step 2: Calculate the annual cost of the alternative method using the same categories.
Contact Us →
Step 3: Quantify operational savings from switching (reduced validation downtime and reduced technician labor). Be conservative, only count savings you can document.
Step 4: Calculate net annual savings by subtracting the alternative method’s annual cost from the sum of your current method’s cost plus operational savings.
Step 5: Calculate payback period by dividing the additional equipment investment by the net annual savings.
Example calculation for a facility switching from optical counting to real-time aerosol monitoring:
In this example, the real-time monitoring system pays for itself in less than a year through downtime reduction alone.
The ROI calculation above assumes significant downtime costs. For facilities with lower downtime costs or less frequent validations, the ROI may be weaker. Perform a sensitivity analysis by varying key assumptions:
Identify which factors drive your facility’s costs, then select the alternative method that addresses your specific constraint most cost-effectively.
Key Takeaway Switch to alternatives when the operational savings (downtime reduction, labor reduction, contamination prevention) exceed the additional equipment investment within 18-24 months. If payback period exceeds 24 months, the alternative method may not be justified unless regulatory compliance or contamination control risk provides additional value.
Regulatory bodies do not mandate specific particle counting methods, they require documented evidence that your contamination control strategy works and that any detection equipment you rely on is validated and under control. This flexibility opens the door to alternatives, but only if you validate them properly and document the validation in a way that auditors will accept.
When you transition from traditional optical counting to an alternative method, regulators expect to see a formal validation study demonstrating that the new method is equivalent or superior to the old one. The validation protocol follows this sequence:
Phase 1: Run your existing optical counter under normal operating conditions for 4-12 weeks and document all results, calibration records, and deviations.
Phase 2: Deploy the new detection system in the same locations and under the same conditions as your baseline method, collecting data simultaneously from both systems.
Phase 3: Compare results from both methods using statistical analysis. For viable cell detection, acceptable correlation is above 0.85 with agreement within ±25%. For particle counting, acceptable agreement is typically ±10-15%.
Phase 4: Document the validation study, obtain quality assurance approval, and formally transition to the new method.
This four-phase approach typically requires 8-16 weeks and involves significant technician time.
Real-time aerosol monitoring systems must be validated for sensitivity, accuracy, and reproducibility. You establish sensitivity by running the system against known particle concentrations and confirming detection at the sizes and concentrations your facility must control. Accuracy is validated by comparing real-time counts to simultaneous optical counting at multiple locations. This validation typically requires 4-8 weeks.
Biofluorescent detection systems require validation that the method reliably identifies viable cells and does not produce false positives. Validation involves running the biofluorescent system in parallel with traditional viable plate counting and confirming agreement within ±25%. Because viable plate counting requires 24-48 hours of incubation, this validation phase is typically 6-12 weeks.
Airflow visualization systems do not require the same quantitative validation as counting systems, but they do require documented procedures and trained personnel.
USP 797 and USP 800 do not prescribe specific detection methods. They require that you monitor for contamination using methods appropriate to your facility’s risk, giving you flexibility to use alternatives if you validate them and document that they are fit for purpose. GMP auditors expect to see validation protocols, calibration records, and data showing that your chosen method reliably detects contamination at the levels your facility must control.
ISO 14644 similarly allows flexibility in monitoring methods but requires that your monitoring equipment be validated and that you maintain calibration records. Calibration wafer standards become essential for optical and aerosol monitoring systems.
For semiconductor fabrication, SEMI standards provide more specific guidance. SEMI F1063 addresses particle detection equipment qualification, requiring that optical counters be validated against calibration wafers and that detection systems demonstrate accuracy within specified tolerances.
The FDA does not mandate specific particle detection methods. Instead, it requires that facilities demonstrate control of contamination through appropriate environmental monitoring. If you use real-time aerosol monitoring data to support a batch release decision, you must be able to demonstrate to an FDA investigator that the monitoring system is accurate and that the data is reliable.
A realistic timeline for switching from optical counting to real-time aerosol monitoring is 12-20 weeks from decision to full deployment:
This timeline assumes dedicated personnel for validation activities. If validation work is assigned to technicians with other responsibilities, the timeline extends to 6-9 months. Budget for 200-400 hours of technician time, depending on the number of monitoring locations and facility complexity.
The validation cost is often the deciding factor for smaller facilities. If your facility operates only one or two cleanrooms and performs validations infrequently, the cost of validating an alternative method may exceed the operational savings from switching. For larger facilities with multiple cleanrooms and frequent validations, the validation cost is typically recovered within 12-24 months through labor savings and reduced downtime.
Watch Out Do not deploy an alternative method without completing this validation protocol. Auditors will reject unvalidated data, and you cannot use it to support regulatory submissions or facility certifications. The validation cost is real, but the cost of non-compliance is far higher.
The decision to switch from traditional particle counters to alternatives depends on comparing equipment costs, operational savings, and risk reduction. For some facilities, the switch makes immediate financial sense. For others, traditional methods remain optimal.
Real-time aerosol monitoring systems represent significant equipment investment, typically more than a portable optical counter. However, they eliminate sampling labor and reduce validation downtime. If your facility runs weekly validations requiring four hours of setup and analysis per week, you’re investing roughly 200 hours annually in optical counting labor. Real-time systems reduce this to near-zero, freeing technicians for other work.
Biofluorescent detection systems cost less than comprehensive real-time monitoring but require consumables for each test. Calculate your annual cost of traditional optical counting (equipment, maintenance, labor, validation downtime) and compare it to the cost of alternatives. The break-even point typically occurs within 18-36 months for facilities with high validation frequency.
Throughput gains from faster contamination detection translate directly to ROI in manufacturing environments. If real-time aerosol monitoring detects a contamination event two hours faster than optical sampling would have, and that early detection prevents a batch failure, the value of that detection far exceeds the equipment cost. In semiconductor fabrication, where a single wafer lot might be worth tens of thousands of dollars, preventing one contamination-related loss justifies years of monitoring equipment investment.
Contamination control ROI also includes regulatory compliance value. Facilities with documented, validated monitoring programs face lower audit risk and faster regulatory approvals. The strongest business case for switching occurs when alternatives address specific operational pain points: facilities with high validation frequency benefit from real-time systems, pharmaceutical operations benefit from biofluorescent speed, and semiconductor manufacturers benefit from calibration wafer validation.
Key Takeaway Switch to alternatives when they solve a specific operational problem, validation downtime, speed to results, or continuous monitoring need, not because they’re newer technology. The best alternative is the one that delivers measurable operational or compliance improvement for your facility’s specific requirements.
Switching from traditional particle counters to alternatives requires careful evaluation of your facility’s specific needs, regulatory environment, and operational constraints. Applied Physics has supported this transition across semiconductor, pharmaceutical, and biotech sectors, providing equipment and validation expertise that helps facilities implement alternatives with confidence. Whether you’re deploying real-time aerosol monitoring for continuous oversight, biofluorescent detection for rapid viable cell assessment, or calibration wafer standards for measurement validation, the key is matching the method to your facility’s actual contamination control challenge. Contact Us to discuss which alternatives align with your regulatory requirements and operational priorities.
Biofluorescent particle counters detect viable cells by measuring autofluorescence without requiring incubation. Traditional optical counters measure all particles regardless of viability through light scattering. Biofluorescent methods deliver results in minutes instead of days, enabling real-time contamination control in cleanrooms and pharmaceutical facilities. However, they measure viable cells only, missing non-viable particles that traditional counters capture. This makes them ideal for rapid monitoring but insufficient as a standalone method for comprehensive particle detection.
Traditional laser particle counters require periodic sampling and cannot provide continuous monitoring. They have fixed detection limits and cannot distinguish between viable and non-viable particles. Setup and calibration are time-consuming, causing validation downtime. Dynamic range limitations mean they struggle with very high or very low particle concentrations. Additionally, they generate large datasets requiring manual analysis, and sampling location bias can miss contamination in critical areas. These constraints make them inefficient for facilities requiring real-time data integrity and rapid response to contamination events.
Airflow visualization using aerosol tracers reveals flow patterns and dead zones that particle counting alone cannot identify. By observing how smoke moves through a cleanroom, technicians validate HEPA filter performance, detect leakage points, and confirm proper laminar flow. This method complements particle counting by showing where contamination originates and how it spreads. For GMP compliance and facility validation, airflow visualization provides the spatial context needed to understand why particle counts fluctuate, making it essential for comprehensive environmental monitoring and process control.
Calibration wafer standards serve a different purpose than particle monitoring. They validate measurement accuracy and provide traceable reference points for semiconductor metrology equipment, ensuring sub-10nm precision in fabrication processes. While they do not replace particle counting for contamination control, they are essential for regulatory compliance in semiconductor manufacturing. Many facilities use them alongside particle monitoring as part of a hybrid strategy to meet both process control and metrology validation requirements. They reduce measurement uncertainty and support FDA and ISO 14644 compliance.
APPLIED PHYSICS TECHNICAL RESOURCE
Airflow visualization, smoke studies, tracer delivery, particle monitoring and controlled-environment validation. Product and standards references should be interpreted for the actual instrument, facility, protocol and configuration.

Enter your details below to save your shopping cart for later. And, who knows, maybe we will even send you a sweet discount code :)
Allow notifications to get real-time updates about your shopping cart and who knows, you may even receive a sweet discount code 😊