
In controlled environments, what you can’t see can compromise everything.
Cleanrooms rely on precision airflow to maintain sterility, but even the most advanced HVAC systems can develop dead zones or turbulence that traps contaminants.
This guide explores the advanced techniques used to visualize airflow, ensuring your facility meets rigorous ISO standards and operational goals.
Airflow is the invisible shield of a cleanroom. Whether you are operating a laminar (unidirectional) or non-unidirectional environment, the goal remains the same: to sweep particles away from sensitive products and processes.
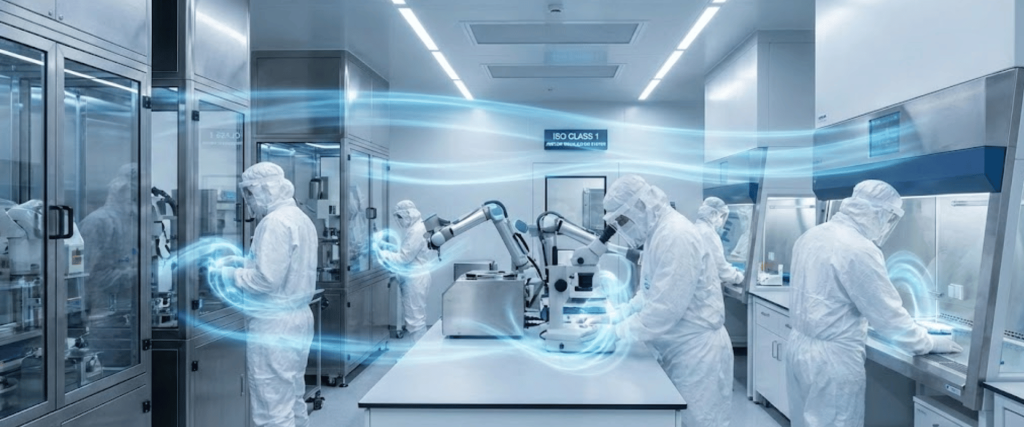
However, physical obstacles such as machinery, personnel movement, or even the placement of a workbench can disrupt these paths. Advanced visualization allows engineers to see these disruptions in real-time, transforming theoretical models into actionable data.
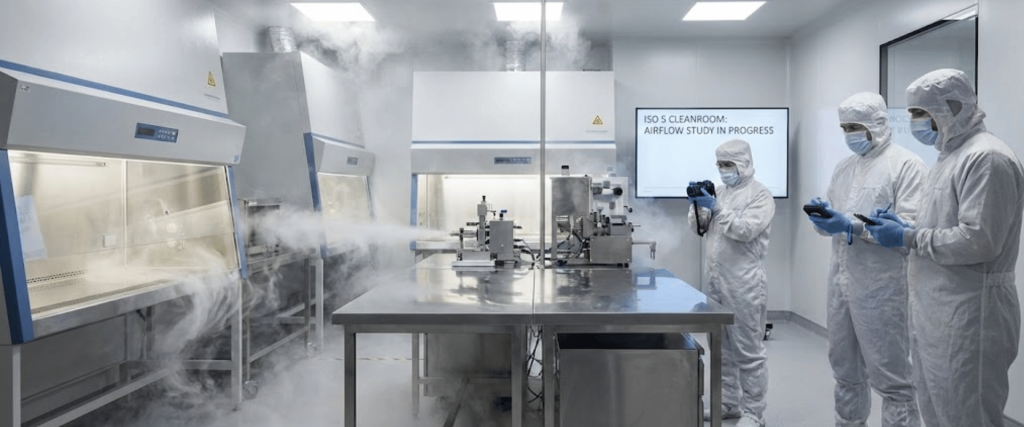
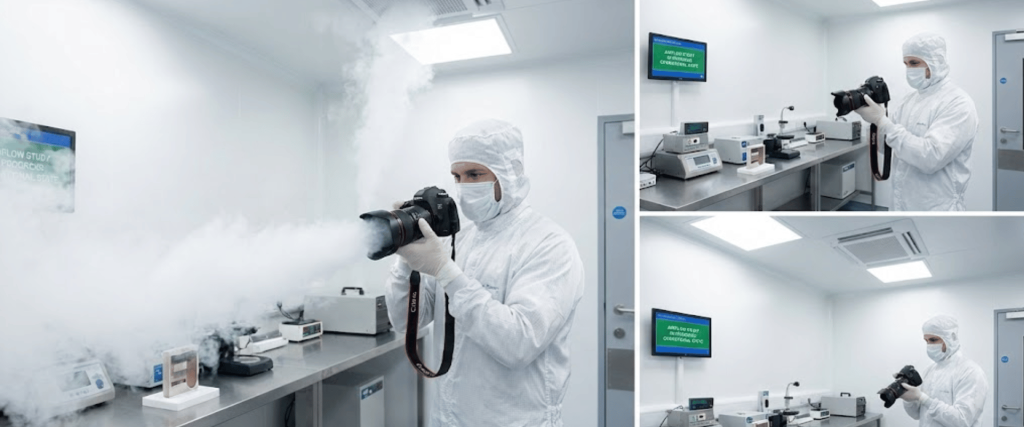
Often considered the industry standard for compliance (ISO 14644-3), smoke studies involve using high-purity moisture droplets or fog to map air patterns.
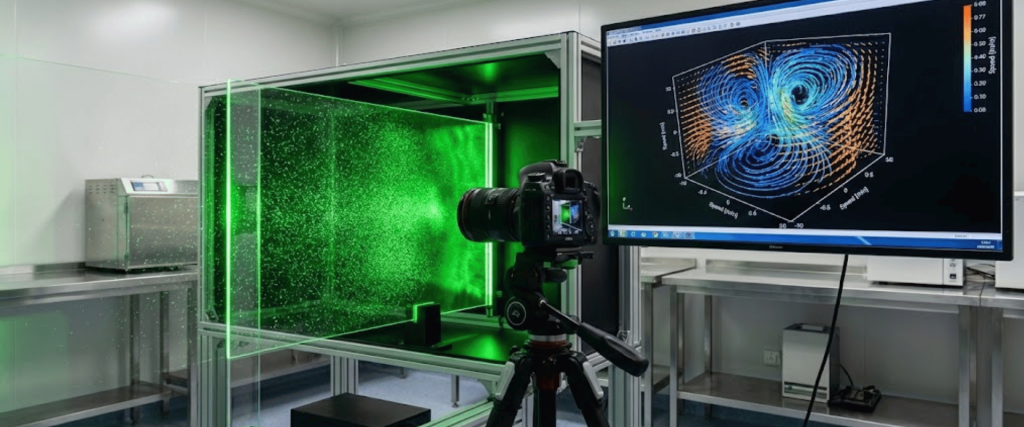
For facilities requiring high-level quantitative data, PIV is the gold standard. It involves seeding the air with tracer particles and using a laser light sheet to illuminate them.
While PIV and smoke studies happen in the physical world, CFD happens in the digital one.

| Anomaly | Impact | Common Cause |
|---|---|---|
| Turbulence | Swirls particles instead of removing them | High‑speed airflow or sharp edges on equipment |
| Stagnant Zones | Allows contaminants to settle on surfaces | Poorly placed exhaust vents or airflow shadows behind large machines |
| Re‑entrainment | Dirty air is pulled back into the clean zone | Pressure imbalances or improper door seals |
To ensure your airflow study provides the most value, follow these strategic steps.
Mastering cleanroom dynamics is no longer about following a set it and forget it mentality.
By utilizing advanced visualization techniques like Cleanroom Airflow Visualization, ultrasonic fogging, and PIV, facilities can proactively identify risks, optimize energy consumption, and ensure the highest levels of product safety.
Airflow visualization, often called a smoke study, is a mandatory requirement for proving that a cleanroom maintains the specific cleanliness class it was designed for. According to ISO 14644-3 standards, it isn’t enough to just have HEPA filters; you must demonstrate that the air effectively sweeps contaminants away from critical work zones. Visualization provides the physical evidence needed for regulatory audits (such as FDA or EMA) to prove that your first air is laminar and unobstructed.
The primary difference lies in purity and residue. Ultrasonic foggers use deionized (DI) water and high-frequency vibrations to create a dense mist that is completely residue-free, making them ideal for ISO Class 5 (Class 100) or higher environments. CO2 generators use dry ice to create fog; while effective and cost-efficient for larger industrial spaces, they can introduce carbon dioxide buildup and are generally not recommended for ultra-sterile environments where chemical trace levels are strictly monitored.
While specific regulations vary by industry (pharmaceutical vs. semiconductor), best practices suggest conducting these studies during initial certification, after any major equipment changes, and during annual or bi-annual re-certification. If you notice a spike in contamination levels or have modified the physical layout of your workstations, a new visualization study should be performed immediately to ensure that new dead zones or turbulence patterns haven’t been created.