
Last Updated: September 13, 2026
Cleanroom air quality validation is the documented process of proving that a controlled environment consistently meets its classified cleanliness level for airborne particles, airflow, and pressure relationships. Validation is no longer a one-time event you schedule and forget. It’s a lifecycle obligation, and the facilities that treat it that way pass audits with far less friction.
The core insight most guides bury: validation doesn’t test whether your cleanroom is clean. It tests whether your cleanroom can stay clean under real operating conditions, and whether you can prove that with data. That distinction shapes every test below.
Every validation runs against three distinct states, defined by ISO 14644 (iso.org). As-built is the empty room with systems running but no equipment or people. At-rest adds installed equipment, still no personnel. Operational is the room doing actual work, with staff and processes active.
Most facilities certify at-rest and then discover their operational particle counts fail. That gap is where contamination control programs quietly fall apart.
ISO 14644 governs cleanroom classification and test methods internationally. GMP requirements, enforced by the FDA for pharmaceutical and sterile compounding operations, layer additional expectations on top: documented protocols, calibration records, and data integrity controls (the FDA).
If you make sterile drug products, you answer to both. If you fabricate semiconductors, ISO 14644 plus your customer specifications typically govern. Identify which framework applies before you write a single test protocol, because the acceptance criteria differ.
The most common validation failure isn’t a dirty room. It’s arriving on test day with uncalibrated instruments, incomplete documentation, or HVAC problems you could have caught a week earlier. Preparation is where you win or lose the schedule.
Run this checklist before any test:
Before particle testing, confirm your HVAC system delivers the design air change rate and that supply diffusers produce uniform air distribution. Review as-built drawings against the current room configuration. If the room was modified, your drawings are probably stale, and stale drawings invalidate your baseline.
Documentation review sounds bureaucratic. In practice, it’s the step that prevents a re-test next month.
HEPA filter integrity testing is the first and most consequential test in any validation sequence. A single pinhole leak in a filter or its gasket can compromise an entire classified area, and particle counts alone often miss it because the leak is localized.
The test verifies that the filter and its sealing frame prevent unfiltered air from bypassing the filter media. You test every HEPA and ULPA filter, plus the frames and gaskets around them.
The standard method introduces a challenge aerosol upstream of the filter, then scans the downstream face with a photometer. A common setup pairs an aerosol generator with a photometer: the generator produces a controlled challenge concentration, the photometer measures penetration.
Applied Physics supplies both ends of that workflow. The Aerosol Photometer BAP-350 handles HEPA validation with a compact form factor and a 5-inch color touch screen that speeds up scanning and data capture. For aerosol generation, the Aerosol Generator-Cold Type BAG-6D covers pharmaceutical filter leak detection across clean rooms, laminar flow tables, biosafety cabinets, glove boxes, and HVAC systems.
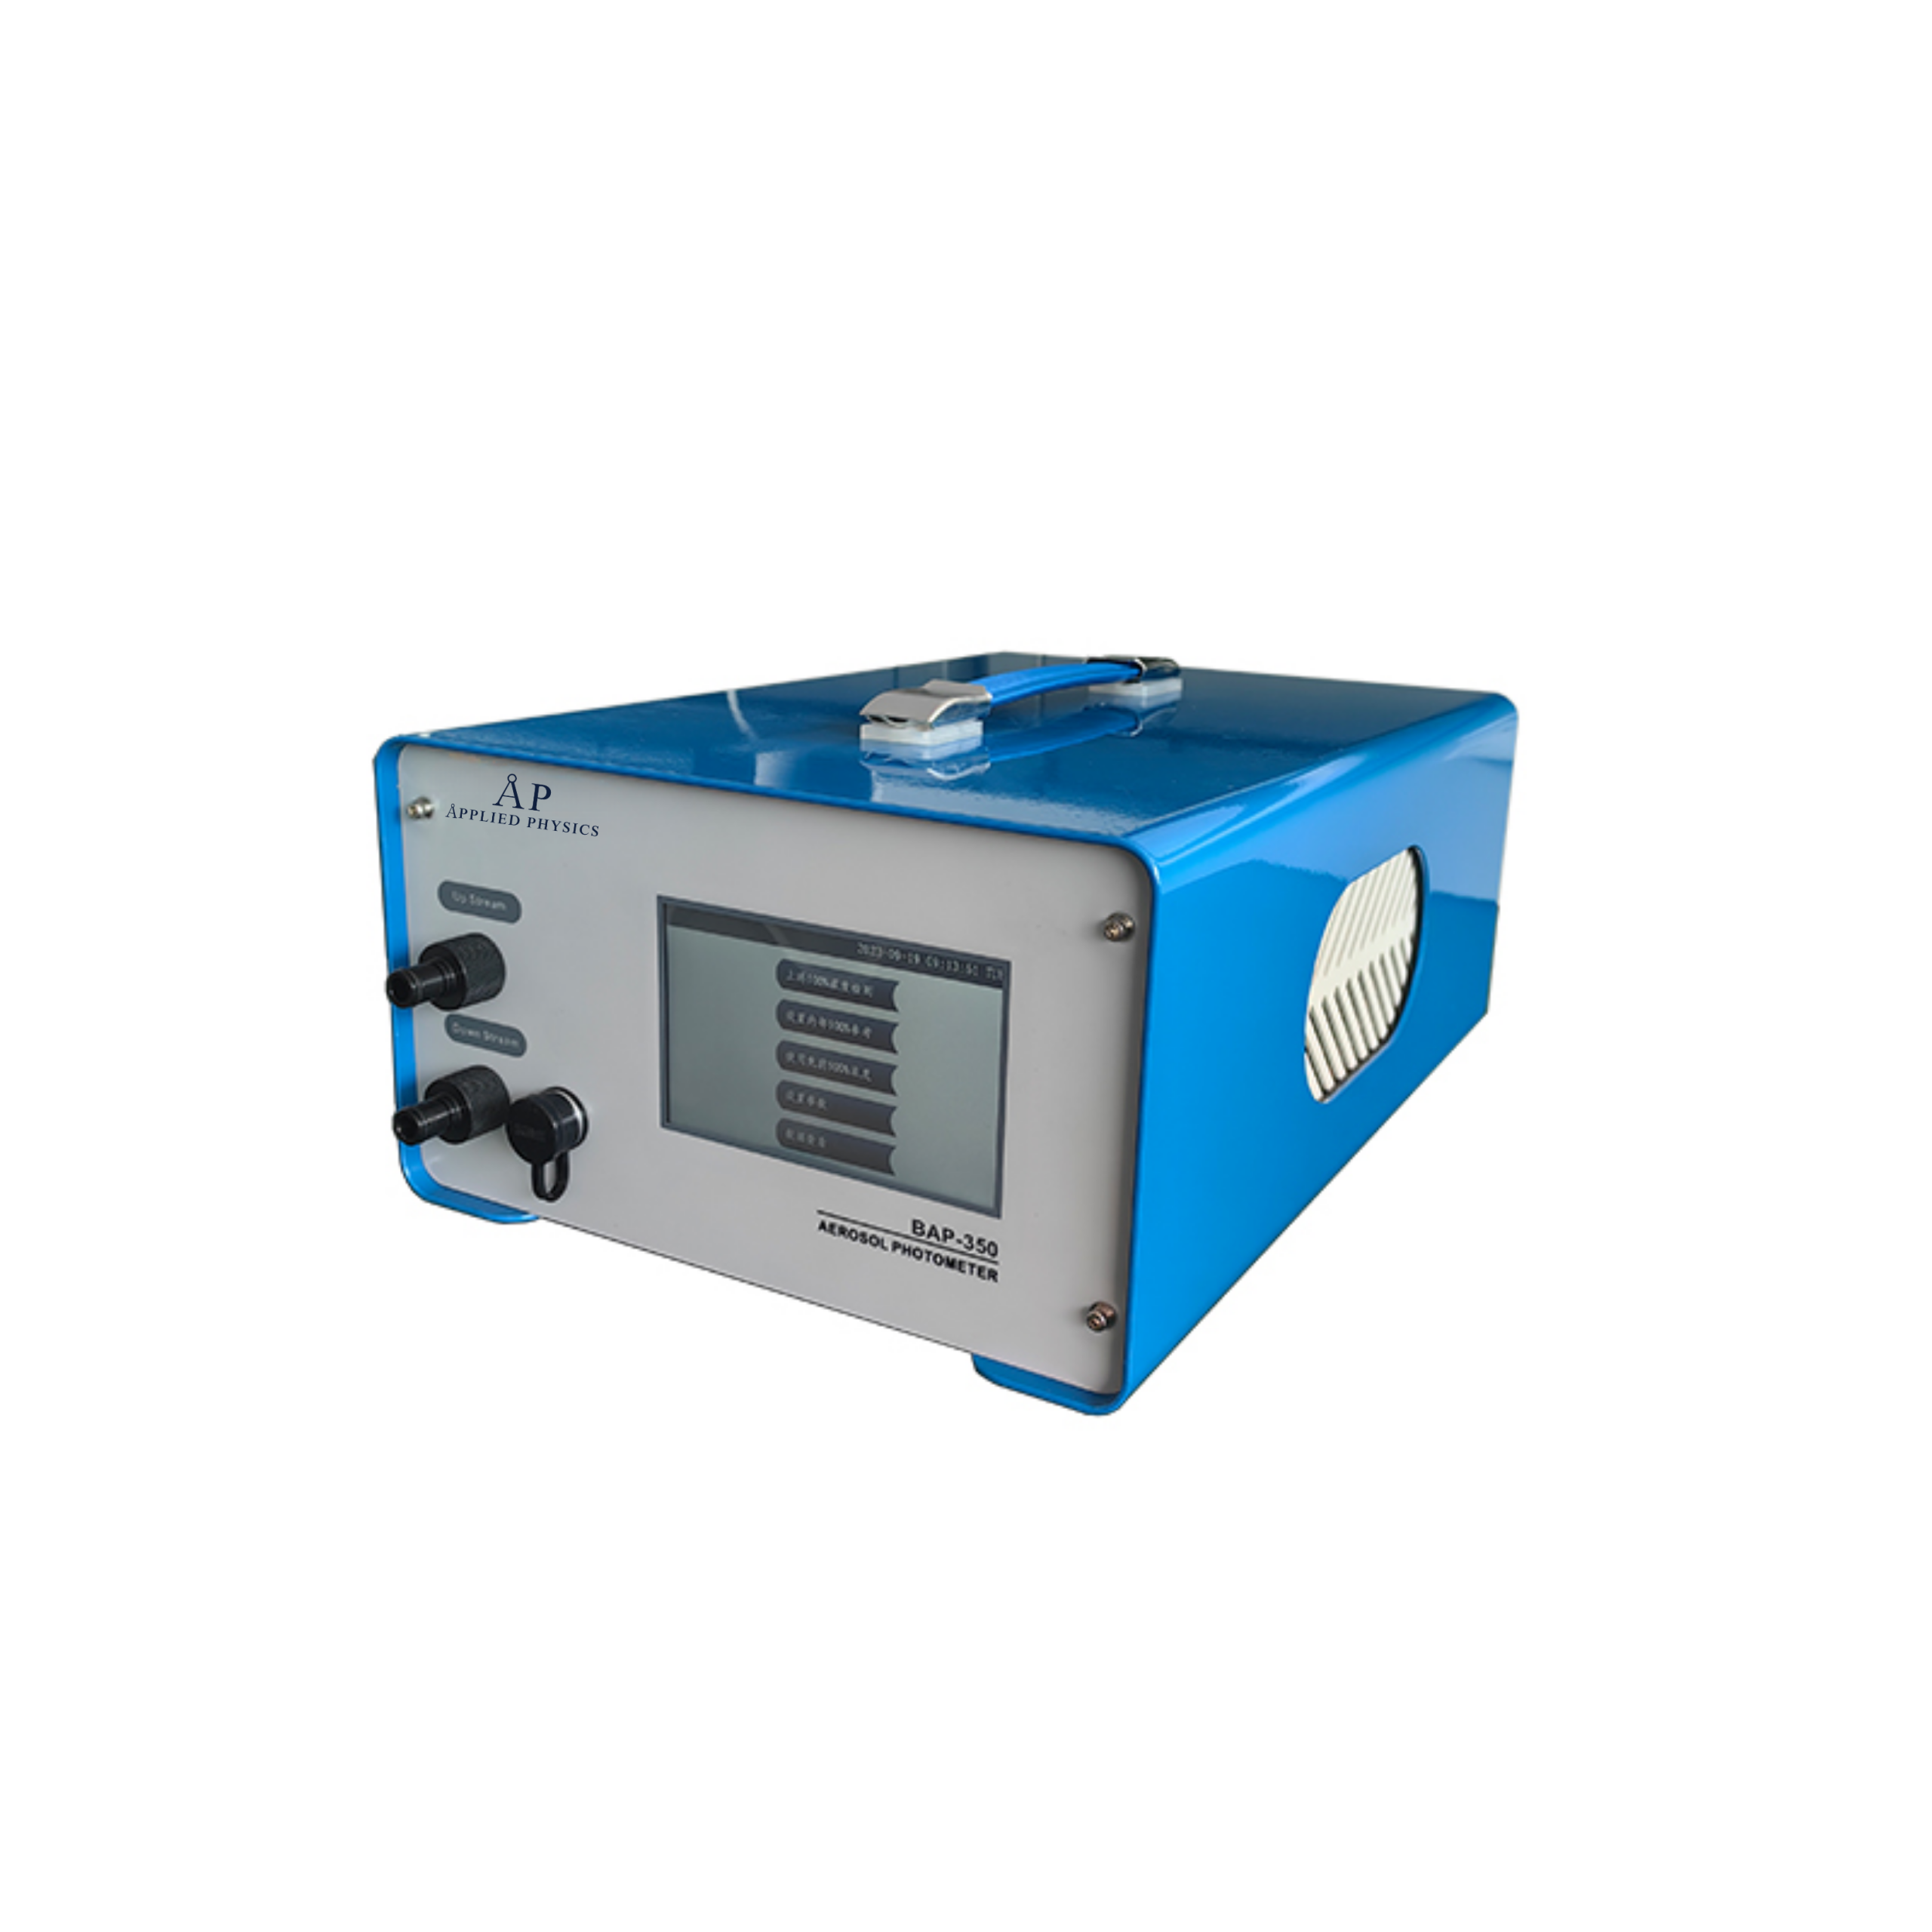
Aerosol Photometer BAP-350
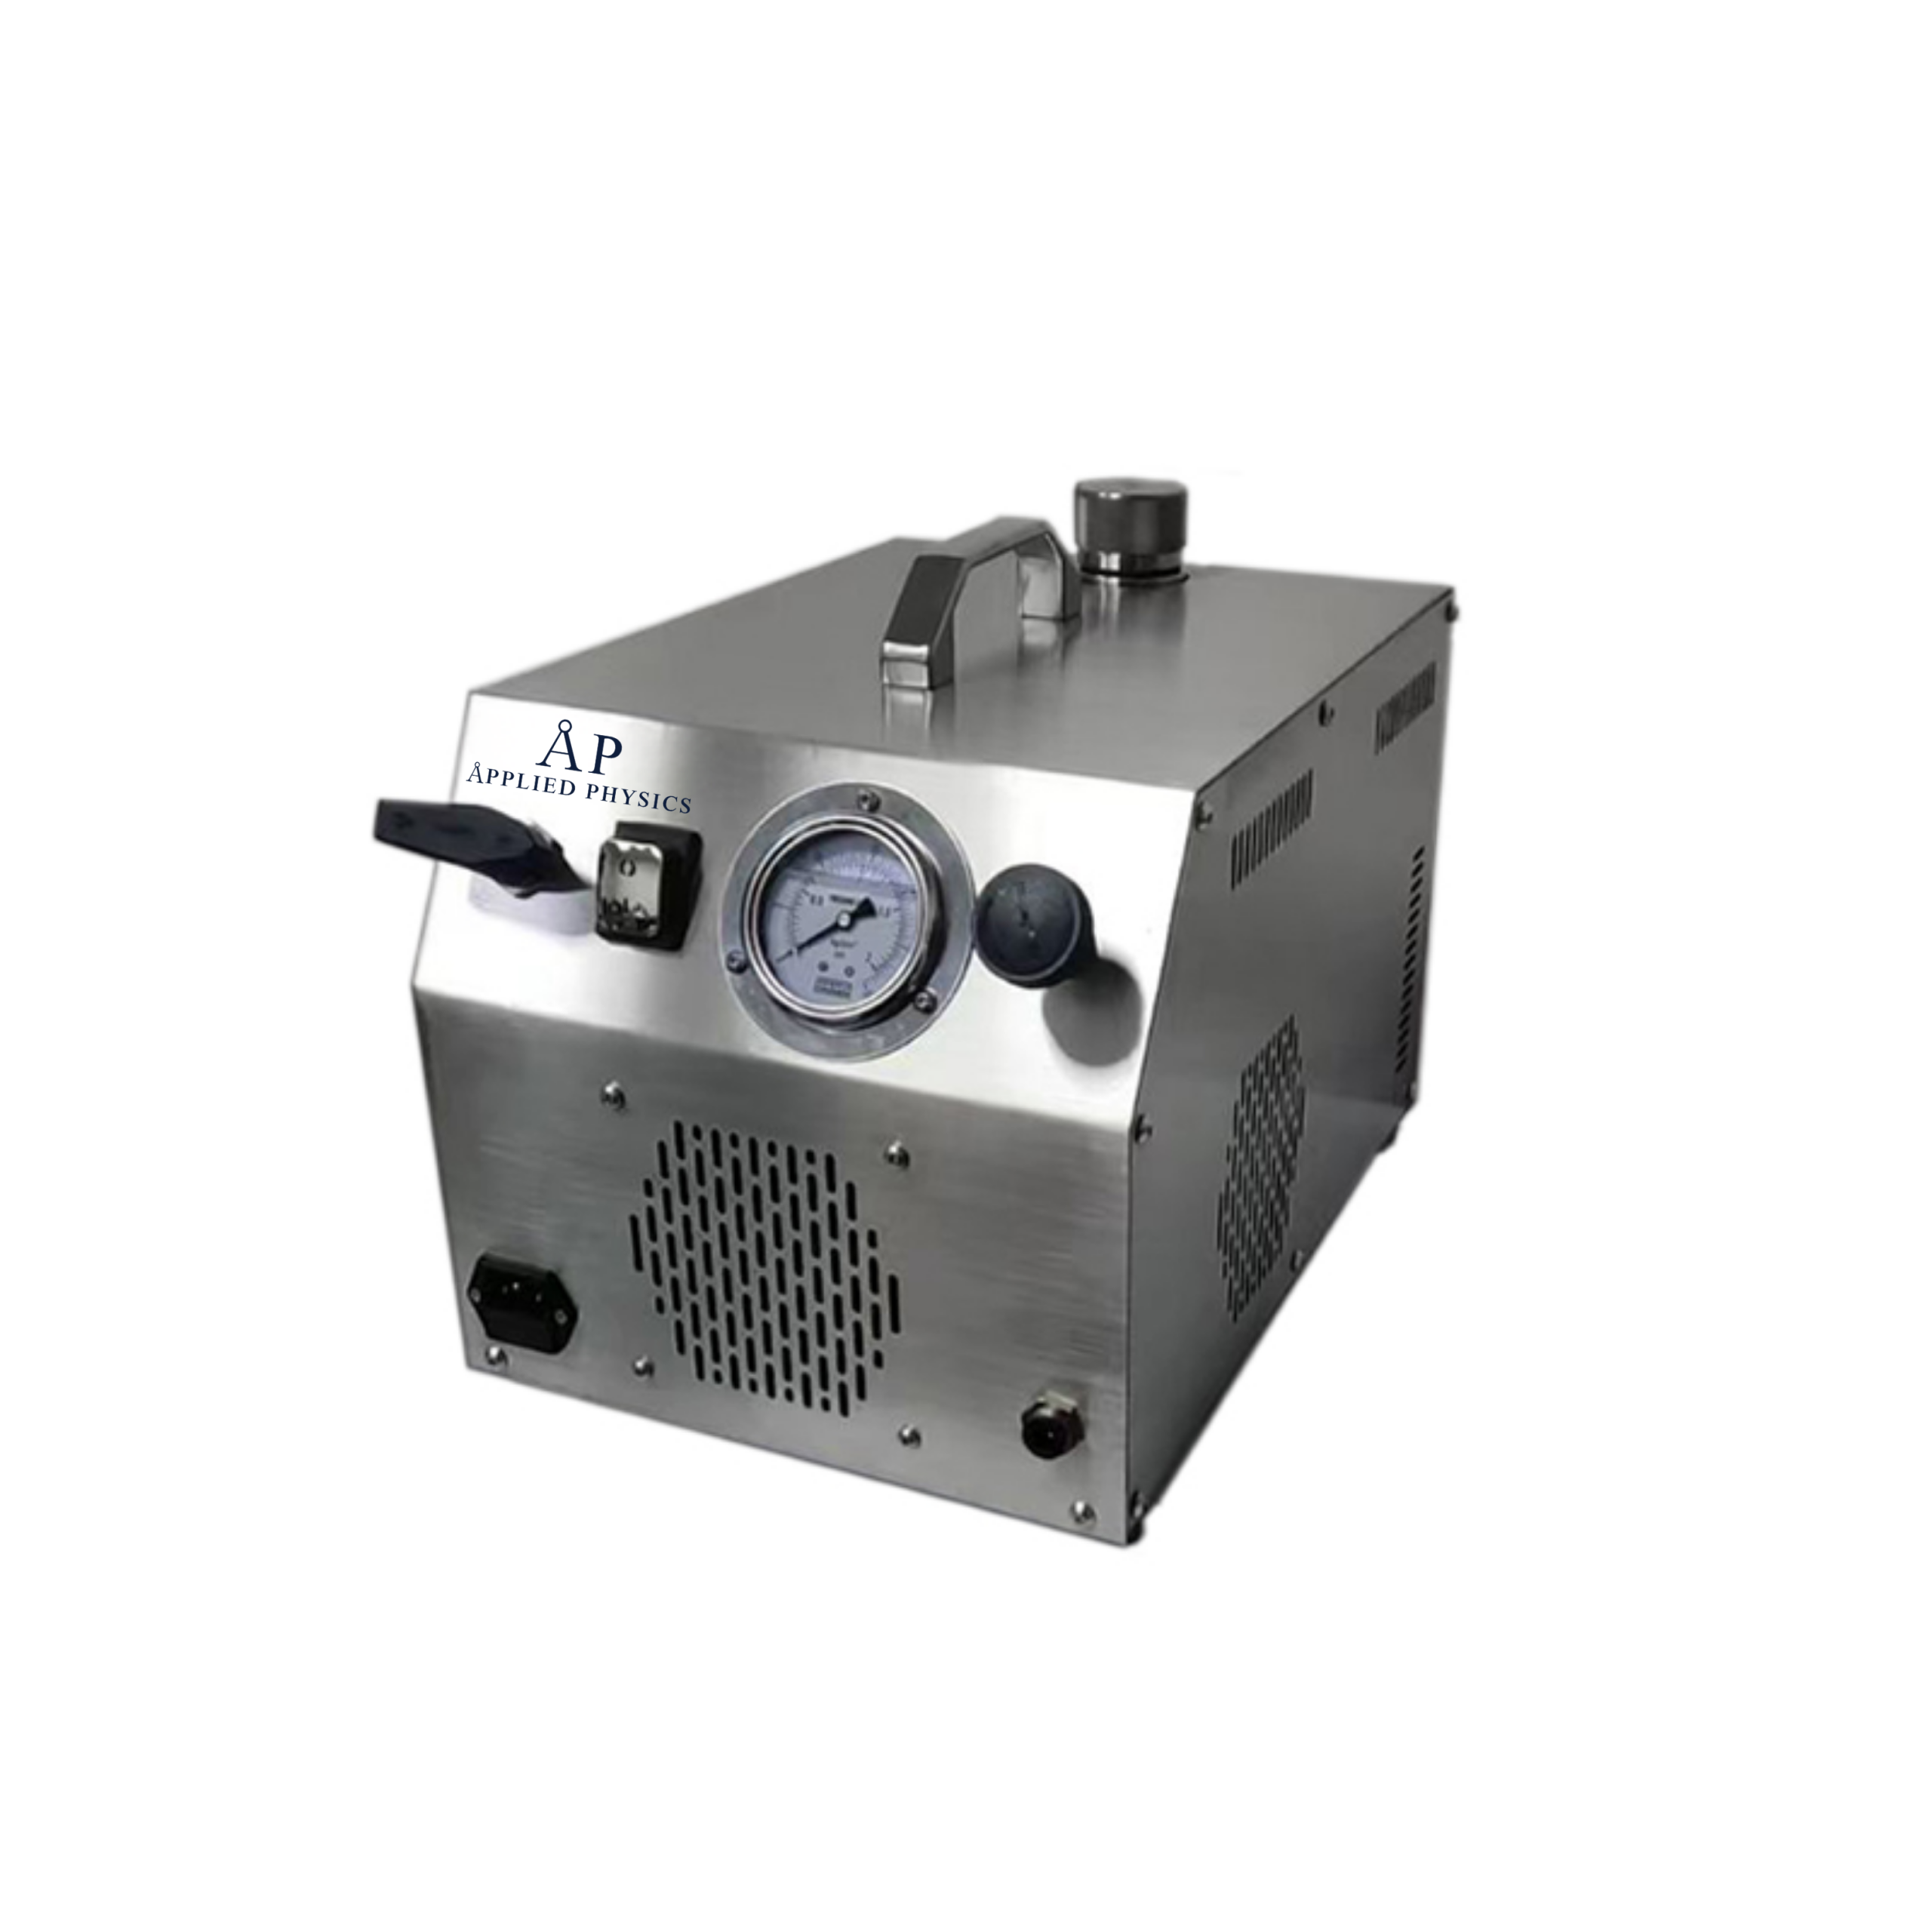
Aerosol Generator-Cold Type BAG-6D
A common mistake is scanning too fast. Move the probe at a controlled rate, overlap each pass, and pay extra attention to filter frame seals and gasket corners. That’s where leaks hide.
Watch Out Testing with an uncalibrated photometer is worse than not testing at all. It produces a pass result you can’t defend in an audit, and if a real leak exists, you’ll discover it during a regulatory inspection instead of on your own schedule.
Airflow velocity testing confirms that air moves through the cleanroom at the rate your classification requires. For unidirectional flow areas, you measure velocity at the filter face; for non-unidirectional rooms, you calculate air change rate from supply volume.
Use a calibrated anemometer and take readings on a defined grid across each supply diffuser. Record every reading, not an average. Uniformity matters as much as the mean value: a diffuser averaging the right velocity but with dead spots will fail operational particle testing.
The instrument detail that trips people up: anemometers drift, and a five percent calibration error changes your acceptance decision. Verify calibration status the morning of the test, not the week before.
Cleanroom airflow visualization uses a visible fog or smoke tracer to reveal how air actually moves through the space. It exposes turbulence, dead zones, and reverse flow that velocity measurements alone cannot show.
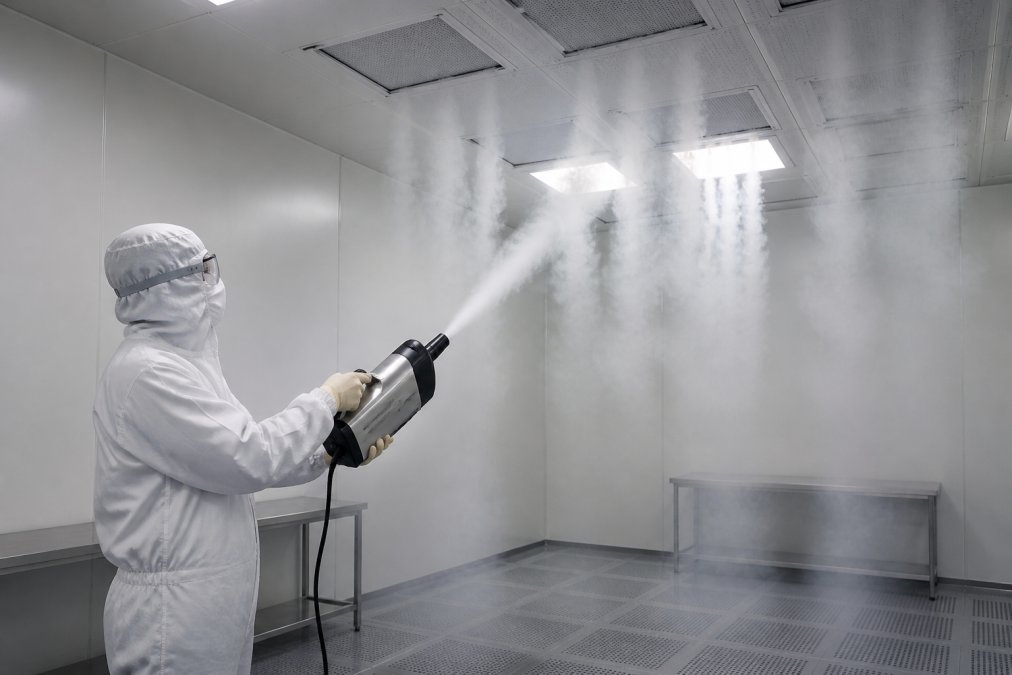
A cleanroom technician in full gowning holding a fogger device, releasing visible white smoke into a cleanroom to visualize airflow patterns from ceiling HEPA filters, with laminar flow streams clearly visible against the room’s surfaces
This is the step where most facilities learn something uncomfortable. Velocity readings look fine, particle counts pass at-rest, and then the smoke shows air rolling back toward a critical zone because a piece of equipment disrupted the laminar flow.
Applied Physics offers both LN2 ultrapure and ultrasonic cleanroom foggers. The practical difference matters: a fogger that produces non-neutral buoyancy sends smoke that rises or sinks on its own, and you end up reading the fogger’s behavior instead of the room’s airflow. Neutral-output fog travels with the air stream, which is the entire point.
Pro Tip Film your smoke studies. Reviewing footage frame by frame catches recirculation eddies that are nearly invisible in real time, and the recording doubles as compliance documentation for your validation report.
Particle count testing measures airborne particulate matter at the sizes your classification specifies, typically 0.5 µm and 5.0 µm under ISO 14644 (iso.org). Sample at defined locations, at the required sample volume, in both at-rest and operational states.
Pressure differential monitoring runs alongside it. Your cleanroom must maintain a positive pressure cascade relative to adjacent, less clean spaces, and that differential must hold continuously, not just on test day. Install continuous monitoring rather than relying on spot readings. Maintaining this controlled environment requires a broader commitment to industrial hygiene monitoring to ensure that airborne contaminants remain within acceptable limits throughout the entire facility.
The Cleanroom Monitoring System – Model CRMS handles continuous particle and environmental monitoring, which converts your validation from a snapshot into a live compliance record. For facilities moving to tighter nodes, Applied Physics provides calibration wafer standards and particle metrology.
A representative test sequence looks like this:
| Step | Test | Typical Duration | Frequency |
|---|---|---|---|
| 1 | HEPA filter integrity | 1-2 hours per filter bank | On install, after change |
| 2 | Airflow velocity and uniformity | 2-4 hours | Annually, after modification |
| 3 | Airflow visualization | 2-3 hours | Annually, after layout change |
| 4 | Particle count | 3-6 hours | Quarterly to annually |
| 5 | Pressure differential | Continuous | Monitored continuously |
Cleanroom validation frequency is not a single calendar rule. It is the product of three inputs: your ISO 14644 classification, your regulatory framework, and the rate of change in the room itself. ISO 14644-2 sets the re-qualification framework, and it explicitly ties the monitoring interval to risk rather than to a fixed clock. GMP environments, enforced by the FDA for pharmaceutical and sterile compounding operations, layer a stricter expectation on top: continuous environmental monitoring plus periodic requalification, with the interval justified in writing.
The baseline schedule most facilities land on looks like this:
The calendar is the easy part. The harder discipline is recognizing that certain events invalidate part of your validation baseline regardless of where you sit in the annual cycle. A partial requalification is triggered by:
Treat each of these as a change-control event. The validation question is not “when did we last test?” but “what changed since the last test, and does the existing data still describe the room?”
Spot-checking once a quarter tells you what the room did on four days out of ninety. Continuous monitoring tells you what it did every day, and that distinction is reshaping how facilities justify their requalification intervals. A continuous particle and environmental monitoring system, such as the Cleanroom Monitoring System – Model CRMS, generates the trend data that supports a risk-based interval extension under ISO 14644-2 and produces the audit trail GMP inspectors expect.
The practical trade-off: continuous monitoring carries a higher upfront instrument cost than a handheld particle counter, but it converts your validation from a snapshot into a live compliance record. When an excursion happens at 2 a.m., you have data. When an auditor asks how you know the room held its classification between quarterly tests, you have an answer that a spot-check schedule cannot provide.
Key Takeaway Validation frequency is a change-management question, not a calendar question. Every modification to the room, the HVAC, or the process resets part of your baseline, and continuous monitoring is what lets you defend the interval between full requalifications.
Most guides stop at listing the tests. The harder question, and the one facility managers actually lose sleep over, is what to do when a test fails. This is the diagnostic framework we walk clients through, organized by the test that failed and the most probable root cause.
A failed scan almost never means the filter media is defective. Work through the causes in this order:
Repair the gasket rather than patching the media. A patched filter is a temporary fix that reappears at the next scan, and auditors treat patch records as a red flag.
This is the single most common operational failure, and it almost always points to airflow disruption rather than a filtration problem. The diagnostic sequence:
If the smoke study shows clean, unobstructed flow and the room still fails, the problem is usually generation rate, not removal rate. Look at the process itself.
A collapsing pressure cascade is a mechanical problem, and the causes are finite:
Recovery time is the test that exposes an underperforming HVAC system. If the room takes too long to return to its classified state after a contamination event, the cause is almost always air change rate below design. Verify supply volume before assuming the filters are at fault. If supply volume is correct and recovery still fails, check for dead zones or short-circuiting revealed by the smoke study.
Each of these failures costs a re-test, and a re-test costs a production day in most facilities. The pattern that separates facilities with clean audit histories from those with recurring findings is not better equipment. It is a pre-validation checklist that catches the mechanical issues early and a smoke study run before the particle count, not after it fails.
Watch Out Do not treat a failed test as a filter problem by default. The majority of failures trace to airflow, sealing, or balance issues that a diagnostic sequence identifies in an hour, while a filter replacement costs a day and often does not fix the underlying cause.
ISO 14644 is the international standard that defines cleanroom classification by airborne particle concentration. Validation under this standard involves testing HEPA filter integrity, airflow velocity and uniformity, particle counts at the specified class limit, and pressure differentials. The results determine whether your cleanroom meets its target ISO class, whether that is ISO 5 for sterile compounding or ISO 3 for semiconductor fabrication. Testing must occur in as-built, at-rest, and operational states.
ISO 14644-2 recommends a maximum testing interval of 6 months for particle count and 12 months for other tests in cleanrooms in continuous operation. High-risk facilities or those with recent modifications may need quarterly testing. After any HVAC change, filter replacement, or room reconfiguration, full revalidation is required regardless of the calendar schedule.
You need a particle counter for ISO classification, an aerosol photometer and aerosol generator for HEPA filter integrity testing, an anemometer for airflow velocity measurements, a differential pressure gauge, and a fogger for airflow visualization. For pharmaceutical and semiconductor applications, calibration certificates traceable to NIST standards are required for all instruments. Data logging capability is also important for compliance documentation.
Common failure points include HEPA filter leaks at gaskets or frames, insufficient air change rates, incorrect pressure differentials between adjacent zones, and turbulent airflow caused by misplaced equipment or supply diffusers. Particle count failures often trace back to inadequate gowning procedures or residual contamination from maintenance work. Reviewing airflow visualization results first usually identifies the root cause faster than re-running particle counts.
APPLIED PHYSICS TECHNICAL RESOURCE
Airflow visualization, smoke studies, tracer delivery, particle monitoring and controlled-environment validation. Product and standards references should be interpreted for the actual instrument, facility, protocol and configuration.

Enter your details below to save your shopping cart for later. And, who knows, maybe we will even send you a sweet discount code :)
Allow notifications to get real-time updates about your shopping cart and who knows, you may even receive a sweet discount code 😊