
Last Updated: September 11, 2026
Cleanroom contamination control is the systematic practice of preventing, detecting, and removing particulate and microbial threats from controlled environments. In biotech, that means building overlapping defenses instead of relying on any single barrier.
The industry’s current playbook comes largely from the revised EU GMP Annex 1, which regulators worldwide now treat as the benchmark for sterile manufacturing. The FDA has signaled similar expectations through its own guidance on sterile drug products, and most U.S. biotech facilities align their programs accordingly. Since 1992, Applied Physics has observed that facilities treating contamination control as a one-time qualification exercise often face challenges, while those that treat it as a living system tend to succeed.
Every contamination control strategy rests on one assumption: contamination has a source, and that source can be identified. Barrier thinking means layering defenses so that when one fails, the next one catches what slips through. A HEPA filter is a barrier. A gowning protocol is a barrier. Differential pressure between rooms is a barrier. The strategy works when all three operate together, and it collapses when any one is treated as optional.
Contamination in a biotech cleanroom comes from five primary vectors, and most facilities underestimate at least two of them. The obvious sources, personnel and equipment, get the most attention. The overlooked ones, facility infrastructure, raw materials, and utilities, cause the failures that show up during audits.
Personnel remain the single largest contamination source in any cleanroom. Every operator sheds particles continuously, and gowning reduces that shedding rather than eliminating it. Equipment introduces contamination through moving parts, lubricants, and outgassing from non-compliant materials. Facility infrastructure contributes through dead zones where airflow stagnates, poorly sealed penetrations, and surfaces that trap rather than shed particles.
A common mistake is mapping only the sources you can see. Microbial contamination often enters through utility lines, water systems, and compressed gas feeds that never appear on a floor plan.
Airflow visualization is the practice of making invisible air movement visible so you can confirm that the cleanroom performs as designed. Foggers that generate neutral-buoyancy vapor are the standard tool: the vapor follows the actual airstream, exposing turbulence, dead zones, and reverse flow that particle counters alone will not catch.
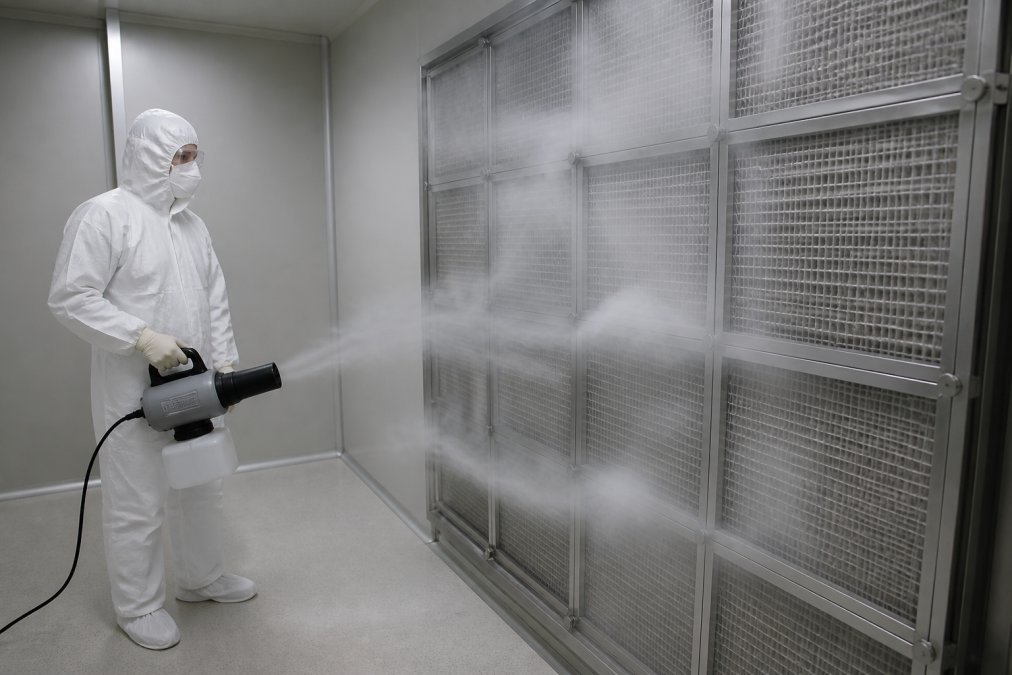
A cleanroom technician in full gowning observes a fogger releasing visible vapor to trace airflow patterns near a HEPA filter bank inside a biotech facility
Here’s what most guides miss: a cleanroom can pass particle counts and still fail airflow visualization. A bench or a piece of equipment placed in the wrong spot disrupts unidirectional flow, creating a wake where contaminants accumulate. The particle counter reads clean because the contamination hasn’t reached the sample point yet. The fogger shows you exactly where it’s pooling. Applied Physics offers both LN2 ultrapure and ultrasonic cleanroom foggers, which are suited for different room sizes and airflow regimes. Selecting the appropriate fogger is crucial for accurate results.
Pro Tip Run airflow visualization before and after any layout change. A single relocated cart or new instrument can shift airflow enough to create a dead zone that no one notices until a sterility failure.
The FDA expects a documented contamination control strategy that ties every control measure to a specific risk. The agency’s guidance on sterile drug products produced by aseptic processing, available through the FDA guidance on sterile drug products, outlines expectations for facility design, environmental monitoring, and personnel qualification. The revised Annex 1 framework, summarized by ISPE’s Annex 1 resources, adds requirements for formal CCS documentation that many U.S. facilities are still building out.
What does that mean in practice? Your CCS needs to name each contamination source, describe the control that addresses it, and specify how you verify the control works. A HEPA filter with no documented integrity test schedule is not a control. It’s an assumption.
FMEA and HACCP answer different questions, and the strongest programs use both. FMEA asks what could fail and how badly. HACCP asks where in the process contamination is most likely to occur and what critical limits prevent it. Together they cover both equipment reliability and process control, and together they produce the traceable risk-to-control mapping that a documented contamination control strategy is expected to contain.
| Method | Core Question | Best Applied To | Typical Output |
|---|---|---|---|
| FMEA | What can fail, and how severe is the effect? | Equipment, utilities, facility systems | Risk priority numbers per failure mode |
| HACCP | Where can contamination enter, and what limit controls it? | Process steps, materials, personnel flow | Critical control points with limits |
Run FMEA on your infrastructure and HACCP on your process flow. A facility that applies only FMEA tends to miss process-driven risks. One that applies only HACCP tends to miss equipment failure modes.
A useful FMEA starts with a defined scope and a cross-functional team: engineering, quality, operations, and microbiology. Each failure mode gets three scores on a 1-to-10 scale:
The Risk Priority Number is S × O × D, producing a range from 1 to 1,000. Most teams set an action threshold, commonly RPN above 100, or any failure mode with Severity of 9 or 10 regardless of RPN, and require documented mitigation for anything above it. Re-score after mitigation and keep the before/after record; auditors want to see that the framework changed decisions, not just that it was filled out.
HACCP follows a seven-principle sequence that maps cleanly onto aseptic processing:
A common pattern is to treat personnel interventions, component transfers, and open-container steps as candidate CCPs, then use the FMEA severity scores to decide which ones warrant formal critical limits versus routine control.
The handoff between FMEA and HACCP is where most programs get thin. FMEA output should feed HACCP hazard analysis (equipment failure modes become process hazards), and HACCP CCP monitoring data should feed back into FMEA occurrence scores (real excursion frequency replaces guesswork). Facilities that close this loop end up with a CCS that updates itself as data accumulates rather than a document that gets rewritten only before an audit.
Pro Tip Score FMEA occurrence using your own deviation and environmental monitoring history, not vendor MTBF figures. A failure mode that has already caused two excursions in the past year deserves a higher occurrence score than a datasheet suggests.
Standard FMEA treats human error as a single failure mode labeled “operator error.” That collapses dozens of distinct causes into one line and hides the highest-risk events in the facility. A more useful approach breaks personnel-related failure modes into specific mechanisms: gowning sequence deviation, glove breach during an intervention, reaching over an open container, tool transfer without sanitization, and speaking or breathing directly over a critical zone.
Each mechanism gets its own severity, occurrence, and detection scores. The result is usually a cluster of high-RPN items that procedural training alone will not fix, they need ergonomic redesign (moving a port so the operator does not have to reach across the airflow), tooling changes (transfer trays that eliminate hand-over-hand passes), or verification checkpoints that do not depend on self-reporting. This is a common gap: human error is often treated as a training problem, when FMEA data can frequently point to a design problem.
Key Takeaway
If your FMEA has one line for “human error,” you have not assessed your largest contamination source. Break it into mechanisms, score each one, and let the RPN ranking tell you whether the fix is training, ergonomics, or automation. :::
.
The right monitoring system matches your room classification, your sampling frequency requirements, and your existing quality management system. Particle counters handle non-viable particulate. Microbial air samplers handle viable contamination. Continuous monitoring systems tie both together and feed data into your deviation and root cause analysis workflows. The hard part is not picking instruments, it is designing a sampling plan that produces data you can defend during an audit and act on during a shift.
Cleanroom classification drives instrument selection more than any other factor. Under the ISO 14644-1 framework that U.S. facilities typically reference, a Grade A or ISO 5 critical zone requires a particle counter capable of sampling at the 0.5 µm and 5.0 µm thresholds with a flow rate high enough to capture a statistically valid sample in a short window, 1 cubic foot per minute (28.3 liters per minute) is the common baseline, with 50 L/min and 100 L/min units used where faster response matters. Lower-classified support areas can be covered with portable units on a rotating schedule.
Microbial air samplers fill the gap particle data cannot: viable organisms that may be present even when particulate counts read clean. Impaction samplers, centrifugal samplers, and slit-to-agar devices each have different collection efficiencies and different suitability for surface, air, and personnel monitoring. Settle plates remain useful for passive monitoring in low-traffic areas but are not a substitute for active sampling in critical zones.
Most monitoring plans place sample points where the room drawing says they should go, near HEPA filters, at the return, at the center of the room. That satisfies a design review but misses where contamination actually accumulates. Sample points should be driven by airflow visualization results, not by symmetry.
A practical placement rule set:
Buying a monitoring system before mapping your airflow is backwards. You will end up placing sample points where the design says they should go, not where contamination actually accumulates. Visualize first, then instrument.
A continuous monitoring system is only as good as its alarm logic. Two failure modes are common: alarms set so tight that operators mute them, and alarms set so loose that excursions are discovered during batch review. A workable approach sets alert and action levels separately, alert levels trigger investigation and trending, action levels trigger a formal deviation and potential batch impact assessment. Alert levels should be based on your own historical data distribution, not copied from a generic table.
Alarm response must be documented before the alarm ever fires. Who is notified, what data is captured, what happens to the batch in progress, and how the event is closed out, all of that belongs in the monitoring SOP, not in an operator’s memory.
Real-time IoT monitoring is moving from novelty to expectation. Sensors that stream differential pressure, particle counts, temperature, and humidity continuously let quality teams catch excursions as they happen rather than discovering them in a batch review days later. But streaming data introduces a data integrity obligation: under 21 CFR Part 11, electronic records used for GMP decisions need audit trails, access controls, and validated software. A dashboard that cannot show who changed what, and when, is a compliance liability regardless of how good the sensors are.
A practical IoT architecture for a biotech cleanroom separates three layers: sensors at the point of measurement, a validated data acquisition layer with time-stamped audit trails, and a reporting layer that feeds deviation and CAPA workflows. Keeping the validated layer distinct from the reporting layer lets you update dashboards without revalidating the entire system.
The practical advantage of a unified monitoring platform is correlation. When particle and microbial data flow into one system, root cause analysis gets faster because you can line up a differential pressure dip, a particle excursion, and a microbial count from the same time window instead of reconciling three separate logs. The system should export in a format your deviation and CAPA software can ingest, and it should retain raw data in a form that survives an audit trail review.
Key Takeaway Monitoring hardware is the easy part. The defensible program is the one with risk-based sample point placement, two-tier alarm levels tied to your own data, and a validated data path from sensor to CAPA. Design that first, then buy instruments that fit it.
Human error causes more contamination events than equipment failure, and most training programs don’t address why. Standard gowning training teaches the sequence. It rarely teaches the reasoning behind each step, which is why operators cut corners when they’re rushed.
The fix is behavioral, not procedural. Facilities that reduce human error typically do three things: they train on the “why” behind each gowning step, they build in verification checkpoints that don’t rely on self-reporting, and they treat near-misses as learning data rather than disciplinary events. A gowning protocol that operators understand is a protocol they follow when no one is watching.
Key Takeaway Personnel intervention is the highest-risk event in any aseptic process. Every time an operator reaches into a critical zone, contamination risk rises. Design workflows that minimize interventions rather than training people to intervene more carefully.
Three shifts are reshaping how biotech facilities approach contamination control, and the facilities preparing for them now will have a significant compliance advantage.
Real-time IoT monitoring is moving from novelty to expectation. Sensors that stream differential pressure, particle counts, and temperature data continuously let quality teams catch excursions as they happen rather than discovering them in a batch review days later. The FDA’s push toward data integrity and the ISPE’s pharmaceutical engineering resources discussion of continuous manufacturing both point in this direction.
Supply chain contamination risks are the second shift. Raw materials, single-use components, and consumables carry contamination risk that no amount of in-house control can eliminate. Facilities that audit their suppliers with the same rigor they apply internally are catching problems earlier.
Sustainability rounds out the picture. Single-use systems reduce cleaning validation burden but generate waste. Facilities balancing both pressures are finding that energy-efficient FFU designs and optimized air change rates cut both cost and environmental impact without compromising contamination control.
For facilities that need to validate airflow patterns, monitor particulates, or maintain calibration standards, Applied Physics has been providing solutions since 1992.
Contamination control in biotech cleanrooms is not a checklist you complete once. It’s a system you maintain, verify, and refine as your facility, your processes, and your regulatory environment change. Applied Physics supports that work with cleanroom foggers for airflow visualization, the Cleanroom Monitoring System Model CRMS for continuous particulate monitoring, the Microbial Air Sampler 3080 Series for viable contamination sampling, and calibration wafer standards for facilities that need precision metrology. Contact Us to learn more about how Applied Physics can support your contamination control strategy.
A complete contamination control strategy combines facility design, HVAC systems with HEPA filtration, personnel gowning protocols, environmental monitoring, cleaning and disinfection procedures, and risk assessment. FDA guidance expects these elements to work together as a documented system. The strategy should define cleanroom classification, air change rates, differential pressure targets, and microbial limits, with regular reviews to confirm the controls still perform as intended.
FDA contamination control strategy requirements emphasize a holistic, science-based approach rather than isolated compliance checks. Facilities must demonstrate that controls are designed, validated, and continuously monitored. This includes environmental monitoring data, deviation investigations, root cause analysis, and corrective actions. The agency expects documented evidence that your CCS prevents contamination rather than simply reacting when excursions occur.
Cleanroom airflow visualization uses foggers or vapor generators to make air movement visible, exposing dead zones, turbulence, and unintended pathways that particle counters alone cannot reveal. During validation and routine checks, it confirms that HEPA-filtered air reaches critical zones and sweeps contaminants away from product contact areas. This technique supports GMP compliance by providing documented evidence of proper airflow patterns.
Validation combines installation, operational, and performance qualification with ongoing monitoring. Start by documenting design specifications, then test HEPA filters, air change rates, pressure differentials, and airflow patterns. Environmental monitoring for particulates and microbes confirms performance over time. Any deviations trigger root cause analysis and corrective action. Periodic revalidation keeps the strategy aligned with current operations and regulatory expectations.
APPLIED PHYSICS TECHNICAL RESOURCE
Airflow visualization, smoke studies, tracer delivery, particle monitoring and controlled-environment validation. Product and standards references should be interpreted for the actual instrument, facility, protocol and configuration.

Enter your details below to save your shopping cart for later. And, who knows, maybe we will even send you a sweet discount code :)
Allow notifications to get real-time updates about your shopping cart and who knows, you may even receive a sweet discount code 😊