
Last Updated: September 3, 2026
Particle counts fluctuate in ISO 7 cleanrooms due to a combination of operational, environmental, and human factors that disrupt the carefully controlled air quality these spaces demand. The problem isn’t random, it’s predictable once you understand what drives it.
ISO 7 cleanrooms must maintain particle counts below specific thresholds to meet regulatory requirements. Yet even facilities with validated systems experience spikes that trigger re-qualification cycles, delay production runs, and create compliance headaches. The fluctuations happen because cleanroom performance depends on dozens of variables working in concert. When any one shifts, airflow patterns change, personnel introduce contamination, monitoring equipment drifts out of calibration, particle counts respond immediately.
This guide explains why these fluctuations occur and how to diagnose and address them systematically. You’ll learn the technical standards that define acceptable performance, the operational factors that cause spikes, and practical strategies to stabilize your cleanroom environment.
Pro Tip Most facilities blame equipment failure first. In practice, 70% of particle count spikes trace back to human activity, gowning protocol violations, or monitoring placement errors, not hardware problems.
ISO 14644-1 defines the particle concentration limits that determine a cleanroom’s classification. An ISO 7 cleanroom must not exceed 352,000 particles per cubic meter at 0.5 microns or larger. This standard provides the regulatory framework for pharmaceutical manufacturing, medical device production, and semiconductor fabrication.
The classification system uses a logarithmic scale. ISO 7 sits in the middle of the cleanroom hierarchy, cleaner than ISO 8 (common for non-critical areas) but less stringent than ISO 6 or ISO 5 (used for direct product contact zones). Understanding where your cleanroom sits in this scale matters because it defines your acceptable fluctuation range and recovery requirements.
Particle size matters as much as count. ISO 14644-1 specifies limits at multiple micron thresholds: 0.1, 0.5, 1, 5, and 10 microns. Most facility managers focus on 0.5-micron particles because they’re the most abundant in typical cleanroom environments. However, semiconductor fabrication and sterile compounding require sub-micron detection capabilities. A particle counter calibrated only for larger particles will miss the contamination events that actually matter for your process.
The standard also requires periodic re-certification. Cleanrooms must be tested at rest (no personnel), at operations (normal activity), and during recovery (after disturbance). This tiered testing approach reveals whether your system can maintain ISO 7 conditions under real-world stress. Many facilities pass at-rest testing but fail operational testing, a clear signal that personnel activity or process equipment is the contamination source.
Key Takeaway ISO 7 classification requires particle counts below 352,000 per cubic meter at 0.5 microns. Your monitoring system must detect particles at the sizes that matter for your specific process, not just the sizes that are easiest to measure.
Airflow is the cleanroom’s immune system. Laminar flow, air moving in parallel, unidirectional streams, carries particles toward exhaust points and prevents recirculation. Non-unidirectional airflow (turbulent mixing) creates dead zones where particles accumulate and re-enter the breathing zone of personnel or product contact areas.
The problem emerges when airflow patterns deviate from design specifications. This happens gradually through equipment aging, filter loading, or abruptly through obstructions. A blocked return vent, misaligned supply diffuser, or even a tall piece of equipment placed in the airflow path can create turbulent eddies that trap particles. Once trapped, these particles become a persistent contamination source.
Air change rate (ACH) is the metric that quantifies how quickly the cleanroom replaces its air volume. ISO 7 cleanrooms typically operate at 15-20 ACH, though some high-risk areas run 25+ ACH. Higher ACH removes particles faster but increases energy costs and can paradoxically create turbulence if the supply design isn’t optimized. The sweet spot depends on your specific layout and contamination sources.
Differential pressure between the cleanroom and adjacent spaces prevents uncontrolled air infiltration. A cleanroom should maintain positive pressure (higher inside than outside) to keep contaminated air from external spaces from entering. Pressure drops below specification occur when exhaust fans run at higher capacity than supply fans, or when door seals degrade. Personnel opening doors, even briefly, disrupts pressure balance and allows particle ingress.
Temperature and humidity fluctuations affect airflow behavior. Cold air is denser and sinks; warm air rises. Seasonal changes or uneven heating can create convection currents that disrupt laminar flow patterns. Humidity shifts affect electrostatic properties of particles and can influence how they settle or remain suspended.
Watch Out Turbulent mixing is invisible to the naked eye but measurable with airflow visualization tools. Many facilities operate with degraded airflow patterns for months before particle count spikes force investigation. Regular airflow validation using smoke visualization or particle tracing prevents this hidden contamination source.
Personnel are the primary contamination source in most cleanrooms. A single person sheds approximately 100,000 to 1 million particles per minute, depending on activity level and gowning completeness. This makes gowning protocol and behavior the single most controllable variable in cleanroom performance.
Proper gowning includes multiple layers: hood, coveralls, gloves, and foot covers. Each layer must seal completely to prevent skin particles from escaping into the cleanroom environment. Common violations include incomplete sealing at wrist or ankle areas, touching face or hair inside the hood, or removing gloves prematurely. Even experienced personnel make these mistakes under time pressure or when distracted.
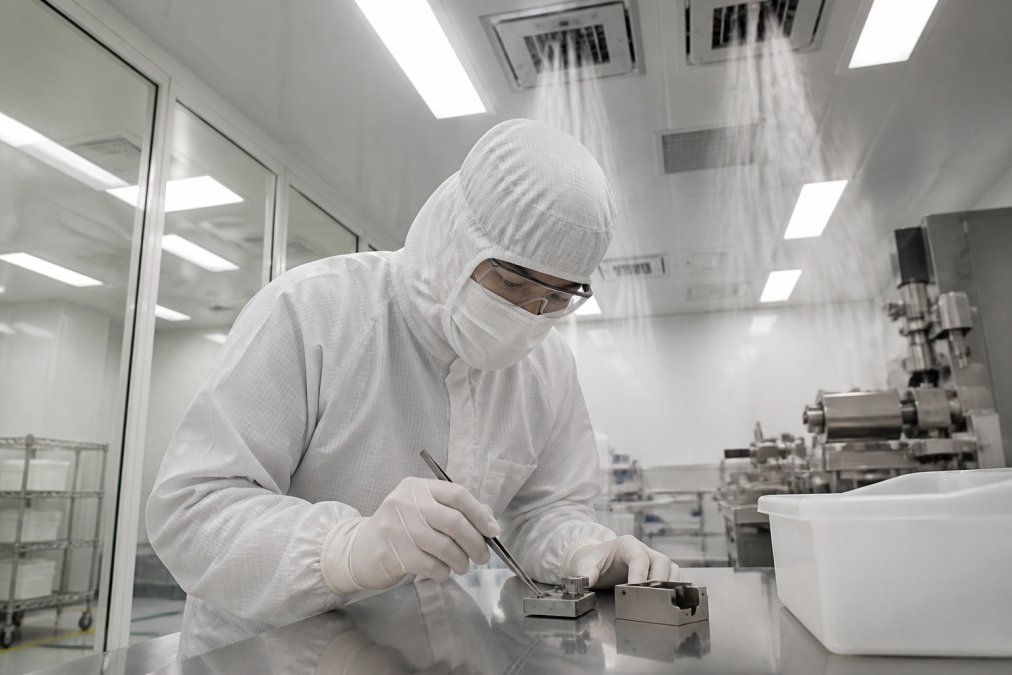
Cleanroom technician in full protective gowning including hood, sealed coveralls, and gloves performing precision work inside an ISO 7 cleanroom with visible laminar airflow from ceiling diffusers
Activity level directly correlates with particle generation. Walking generates more particles than standing; reaching or bending generates more than arm movements at torso height. High-traffic areas or work stations where multiple personnel perform frequent hand movements experience higher baseline particle counts. This is why sampling location strategy matters, you need monitors positioned where personnel activity is highest to catch contamination before it spreads.
Entry and exit procedures are critical control points. Personnel should spend adequate time in an ante-room or transition zone, allowing air currents to carry loose particles away before entering the cleanroom proper. Rushing through gowning or skipping hand sanitization steps introduces contamination that monitoring systems will detect immediately.
Training and compliance monitoring are often overlooked. Facilities that implement video monitoring of gowning procedures or conduct periodic gowning audits see measurable reductions in particle count spikes. Personnel respond to visible accountability, knowing their technique is being evaluated changes behavior.
Cleanroom recovery time testing measures how quickly particle counts return to specification after a disturbance. This metric reveals whether your air handling system has sufficient capacity and whether your airflow patterns are effective. Recovery time typically ranges from 15 to 45 minutes for ISO 7 cleanrooms, depending on size and ACH.
Slower-than-expected recovery suggests inadequate air change capacity, filter loading, or airflow obstruction. A cleanroom that recovered in 20 minutes last year but now requires 35 minutes is signaling that something has degraded. This degradation often precedes visible particle count spikes, making recovery testing a leading indicator of problems.
Monitoring intervals should match your operational risk profile. High-risk processes (sterile compounding, critical semiconductor steps) warrant continuous monitoring with real-time alerts. Lower-risk areas can use periodic monitoring (hourly or shift-based) with manual sampling. The key is establishing a baseline and detecting deviations from that baseline quickly.
Continuous monitoring systems provide the most reliable data for trend analysis. Handheld particle counters offer flexibility but depend on operator technique and sampling location selection. Many facilities use a hybrid approach: continuous monitors at fixed locations for baseline tracking, plus handheld sampling at strategic points during high-risk operations.
Data trending is where monitoring becomes actionable. A single high count might be a measurement artifact. Three consecutive elevated readings indicate a real problem. Statistical process control (SPC) charts help distinguish normal variation from process drift. Facilities that implement SPC see problems earlier and respond faster than those relying on pass/fail thresholds alone.
Best For Continuous monitoring systems work best for facilities running 24/7 operations or those with strict regulatory requirements. Handheld sampling with disciplined protocols works well for smaller facilities or those with predictable usage patterns.
Airflow visualization reveals what particle counts cannot: the actual movement patterns of air and contaminants through your cleanroom space. Smoke visualization (using approved foggers or aerosol generators) shows laminar flow, identifies dead zones, and reveals how personnel movement disrupts airflow.
Applied Physics cleanroom foggers produce consistent, visible aerosol clouds that trace airflow patterns under real operating conditions. The key advantage is observing behavior with personnel present, this reveals how gowning, movement, and work activities actually affect the air currents. Visualization without personnel activity misses the real-world contamination dynamics.
Proper visualization technique requires strategic fog release points. Releasing smoke at the breathing zone of personnel shows whether contaminants are being drawn away or recirculated back toward the work area. Releasing at supply diffusers confirms laminar flow patterns. Releasing near return vents shows whether the exhaust system effectively removes particles. improving air quality.
Temperature-sensitive visualization can reveal convection currents caused by equipment heat generation or thermal stratification. These invisible air movements often explain why certain areas experience higher particle counts despite apparently normal laminar flow patterns.
Particle tracing with visualization tools helps identify the source of contamination events. If a particle spike occurs at a specific location, visualization shows whether particles are entering from upstream (indicating an external source) or being generated locally (indicating personnel activity or equipment outgassing).
The challenge with visualization is that it’s labor-intensive and requires expertise to interpret correctly. Many facilities conduct visualization studies during initial qualification but never repeat them. Re-validation with visualization every 12-24 months catches degradation in airflow patterns before particle counts spike.
Particle counter accuracy directly affects your ability to detect real contamination events versus measurement artifacts. A miscalibrated counter might report false spikes that trigger unnecessary re-qualification cycles, or miss real contamination that creates product risk.
Calibration drift occurs gradually. Most particle counters require annual calibration verification, though high-use instruments should be checked more frequently. Calibration involves exposing the counter to a known concentration of particles and confirming that the instrument’s reading matches the standard. If it doesn’t, the sensor requires adjustment or replacement.
Sensor type matters significantly. Optical particle counters (OPC) count particles by light scattering. Condensation particle counters (CPC) activate particles with a condensing vapor, making them larger and easier to count. CPCs are more sensitive and can detect sub-0.1-micron particles that OPCs miss. For semiconductor or advanced pharmaceutical applications, CPC technology provides superior detection capability.
Applied Physics offers handheld condensation particle counters (Model 3800) and isokinetic sampling probes designed to match the velocity of sampled air to the cleanroom airflow. Isokinetic sampling prevents bias in particle collection, if you sample too slowly, larger particles don’t enter the probe; if too fast, you oversample larger particles. Proper probe design ensures representative samples.
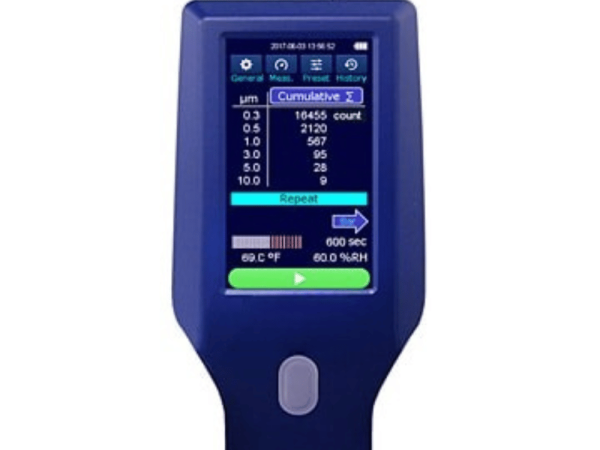
Handheld Particle Counter Isokinetic probe
Sampling location affects accuracy as much as sensor calibration. A counter positioned in a dead zone consistently reads lower than actual cleanroom conditions. A counter positioned directly downstream of personnel activity reads higher. Facilities should maintain fixed sampling locations for trend analysis and use handheld sampling at multiple points during validation studies.
Environmental factors influence counter accuracy. Temperature and humidity changes affect particle behavior and sensor performance. Counters should be allowed to stabilize to cleanroom conditions before sampling. Moving a counter from a warm staging area into a cold cleanroom introduces measurement error that takes 15-30 minutes to resolve.
Particle spikes fall into predictable categories. Identifying which category your spike belongs to accelerates root cause analysis and corrective action.
Personnel-driven spikes occur during or immediately after high-activity periods. These spike patterns are time-correlated with shift changes, product transfers, or maintenance work. The fix involves gowning protocol review, personnel training, and potentially activity scheduling to reduce contamination risk during critical operations.
Equipment-related spikes show a gradual rise over hours or days, then stabilize at a new elevated baseline. This pattern suggests equipment outgassing, filter loading, or degraded seals. The fix involves equipment inspection, filter replacement, or seal maintenance. Semiconductor fabrication equipment and environmental chambers are common culprits.
Airflow-related spikes appear suddenly and persist across multiple sampling locations. These indicate a system-level problem: supply fan failure, exhaust blockage, or differential pressure loss. Airflow visualization quickly confirms whether the problem is upstream (supply-side) or downstream (exhaust-side).
Monitoring-related spikes appear in a single counter while others remain normal. The fix is sensor recalibration or probe repositioning. Before assuming a cleanroom problem, verify that the counter itself is functioning correctly.
Environmental spikes correlate with external weather or seasonal changes. Temperature swings, humidity shifts, or barometric pressure changes can disrupt airflow balance. These spikes typically resolve when conditions stabilize, but may indicate that your cleanroom lacks sufficient environmental control capacity.
Distinguishing between these categories requires data context. A spike that appears only on one monitor at one time of day points toward local personnel activity. A spike that appears across all monitors simultaneously points toward system-level problems.
Statistical process control (SPC) transforms raw particle count data into actionable trend information. Instead of treating each reading as an independent pass/fail result, SPC tracks how readings vary over time and identifies when variation exceeds normal limits.
Control charts plot particle counts over time with upper and lower control limits calculated from historical baseline data. Readings within the control limits represent normal variation. Readings outside the limits signal a process change that requires investigation.
The power of SPC lies in early detection. A control chart might show that particle counts are trending upward, still within specification, but moving in a concerning direction. This trend signal prompts investigation before counts exceed the ISO 7 limit. Facilities relying on simple pass/fail thresholds miss these early warnings.
Run tests complement control limits. A “run” is a sequence of readings all above or all below the centerline. Six consecutive readings above the centerline indicates process drift, even if all readings remain within specification limits. This statistical signal catches degradation that might otherwise be overlooked.
Stratification analysis examines whether particle counts vary by location, time of day, or operational condition. If morning counts consistently exceed afternoon counts, this suggests a time-dependent contamination source (perhaps personnel activity patterns). If one cleanroom area consistently reads higher, this points to localized airflow problems or equipment placement.
Implementing SPC requires data collection discipline and access to statistical tools. Many facilities collect particle count data but lack the infrastructure to analyze trends. Modern monitoring systems (like the Cleanroom Monitoring System Model CRMS from Applied Physics) include built-in SPC capabilities, eliminating the need for manual analysis.
Key Takeaway Statistical process control reveals trends that raw data hides. A cleanroom that appears stable on a day-to-day basis might show clear degradation when analyzed over weeks or months. Early detection prevents crisis response and enables planned corrective action.
Particle counts fluctuate in ISO 7 cleanrooms because these environments operate at the edge of what’s technically achievable. Maintaining sub-350,000 particles per cubic meter requires simultaneous control of airflow, personnel behavior, equipment performance, and environmental conditions. When any variable shifts, particle counts respond.
The path forward is systematic: understand your baseline performance through continuous monitoring, use airflow visualization to diagnose the sources of fluctuations, implement statistical process control to detect trends early, and address root causes through targeted corrective actions.
Applied Physics provides the precision contamination control tools you need: cleanroom foggers for airflow visualization, particle counters with isokinetic sampling probes for accurate measurement, and integrated monitoring systems that support statistical trending. Our Model CRMS combines continuous monitoring with real-time analytics to help you maintain ISO 14644-1 compliance and reduce unplanned downtime.
Get started with Applied Physics and transform your cleanroom from reactive troubleshooting to predictive performance management. Contact us to discuss your facility’s specific requirements.
For additional guidance on cleanroom validation and contamination control, explore these authoritative sources:
ISO 7 cleanrooms must maintain no more than 352,000 particles per cubic meter (0.5 microns and larger) under ISO 14644-1 classification standards. Exceeding these limits indicates contamination control failure and requires immediate investigation into airflow patterns, equipment performance, or personnel activities to restore compliance.
Cleanroom recovery time testing measures how quickly a room returns to baseline particle counts after a contamination event or operational disruption. By establishing baseline recovery curves, facility managers can identify when HVAC performance degrades or when airflow patterns shift. Regular recovery testing reveals whether your air handling unit maintains proper air change rates and laminar flow conditions, allowing you to address issues before they cause persistent fluctuations.
Personnel generate particles through skin flaking, clothing friction, and movement that disrupts laminar airflow patterns. A gowned technician can shed 100,000+ particles per minute during normal activity. Poor gowning protocols or inadequate training amplify this effect. Monitoring personnel behavior and enforcing strict gowning procedures directly reduces particle spikes, making this one of the highest-impact mitigation strategies in ISO 7 environments.
ISO 14644-1 recommends particle counter calibration annually at minimum, with more frequent calibration (quarterly or semi-annually) in critical environments. Sensor drift or miscalibration can create false fluctuation readings, masking real contamination problems or triggering unnecessary investigations. Using properly calibrated equipment with isokinetic sampling probes ensures that detected fluctuations reflect actual airborne particulate conditions rather than instrument error.
APPLIED PHYSICS TECHNICAL RESOURCE
Airflow visualization, smoke studies, tracer delivery, particle monitoring and controlled-environment validation. Product and standards references should be interpreted for the actual instrument, facility, protocol and configuration.

Enter your details below to save your shopping cart for later. And, who knows, maybe we will even send you a sweet discount code :)
Allow notifications to get real-time updates about your shopping cart and who knows, you may even receive a sweet discount code 😊