In the pharmaceutical and biopharmaceutical sectors, the sterility of the manufacturing environment is non-negotiable.
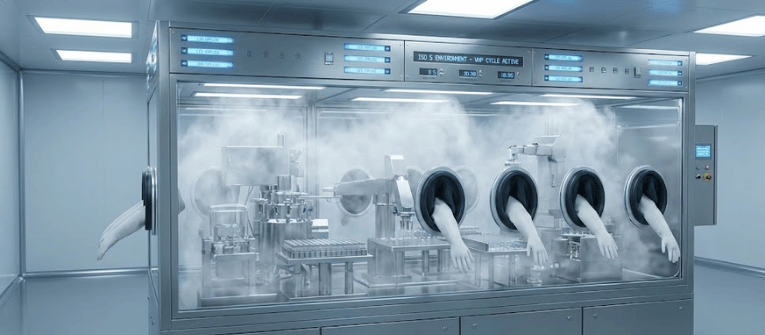
Barrier isolators and Restricted Access Barrier Systems (RABS) have become the industry standard for aseptic processing, relying heavily on Vaporized Hydrogen Peroxide (VHP) for bio-decontamination.
However, injecting VHP into an isolator is only half the battle. The efficacy of the sterilization cycle is entirely dependent on the distribution of that vapor.
Without uniform dispersion, dead zones can survive the cycle, compromising the sterility assurance level (SAL).
Understanding the physics of VHP distribution and validating it through visual airflow modeling is critical for regulatory compliance and product safety.
To understand VHP distribution, it is important to distinguish between a gas and a vapor. Hydrogen peroxide in VHP systems exists as a two‑phase condition, where vapor and liquid are in balance. When VHP is injected into an isolator, it enters as a hot vapor.
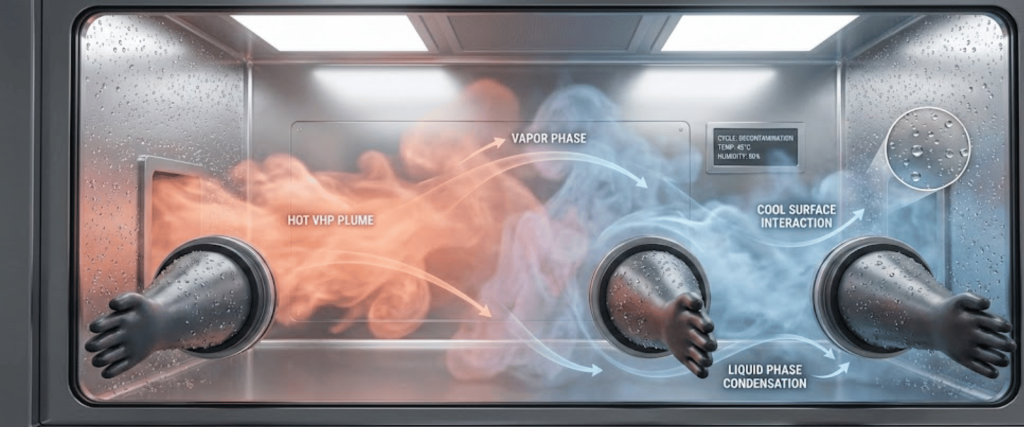
As it contacts cooler surfaces such as walls, gloves, and equipment, it loses heat. If the local concentration becomes higher than what the temperature can support, micro‑condensation forms.
This micro‑condensation is often responsible for the fastest microbial kill. However, it also creates a challenge: if vapor does not reach certain areas because of poor airflow, condensation will not occur and those surfaces may remain non‑sterile. For this reason, proper airflow and air movement are critical to effective VHP sterilization.
The distribution of VHP is governed by the airflow patterns within the isolator. Ideally, the airflow should be laminar (unidirectional), ensuring that the sterilant sweeps over every surface evenly.
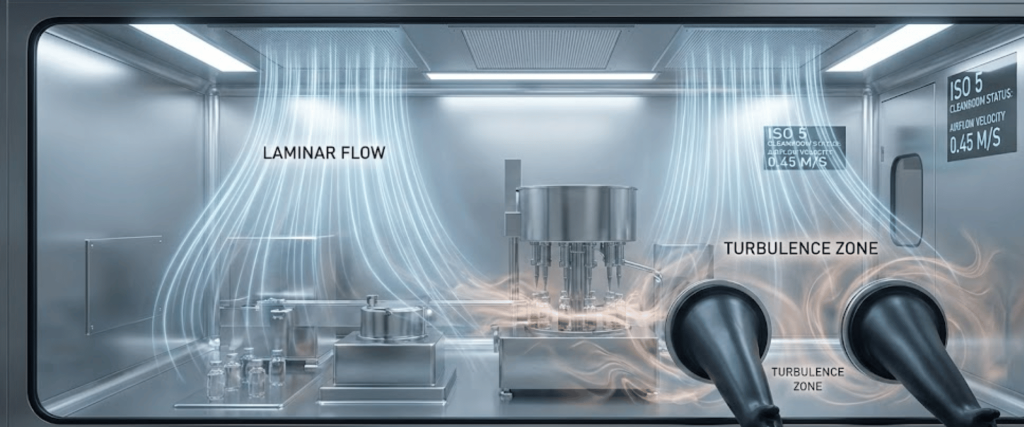
However, the complex geometry of isolators filled with vial fillers, stopper bowls, and glove ports creates inevitable disturbances.
When air flows around an object, it can create a wake or a vortex on the leeward side. In these areas, air velocity drops significantly, creating a dead zone.
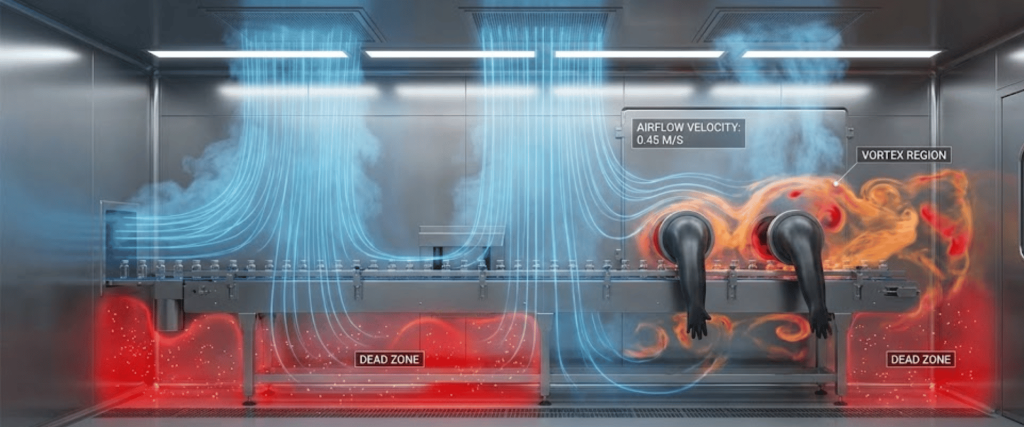
In a VHP cycle, a dead zone means the sterilant concentration may never reach the lethal threshold required to kill biological indicators (BIs).
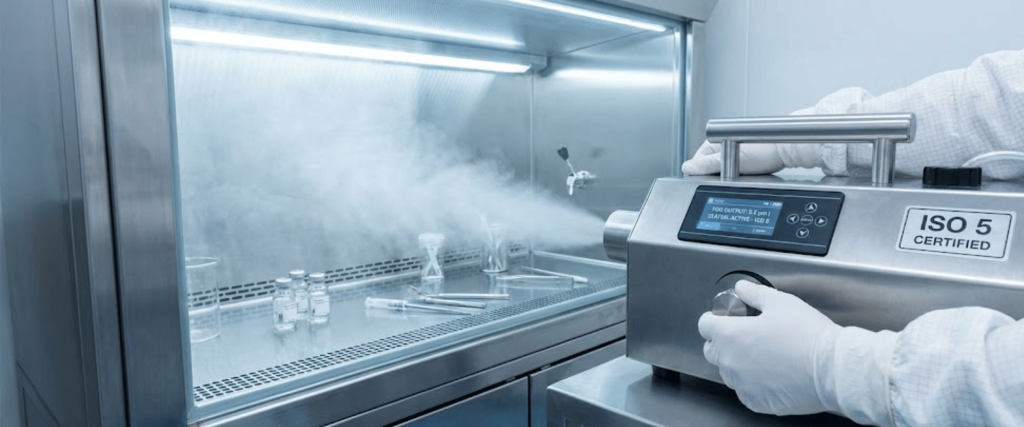
Because VHP is invisible to the naked eye until it heavily condenses, operators cannot visually confirm that the sterilant is reaching critical areas during a standard cycle. This is where Airflow Visualization Studies (often called smoke studies) become essential.
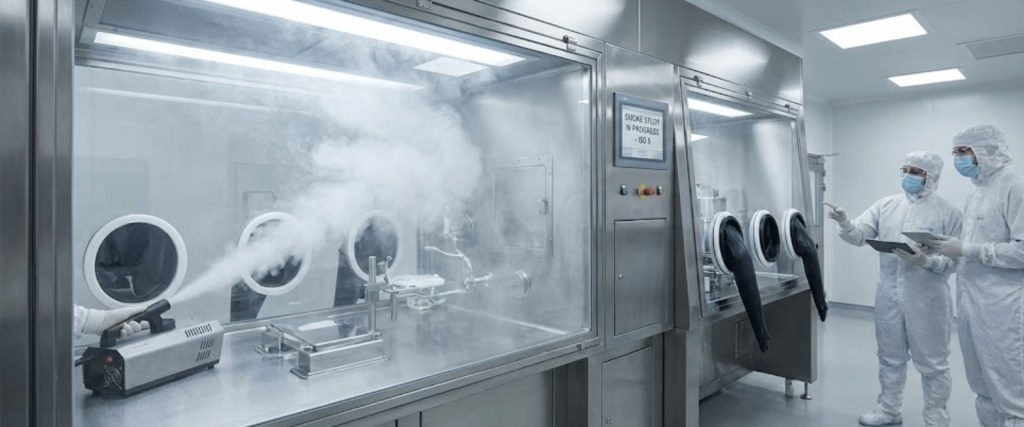
Regulatory bodies, including the FDA and those enforcing ISO 14644-3 and USP <797>, require in-situ airflow analysis to prove that the air (and by extension, the VHP) is moving correctly.
To map these invisible patterns, facility managers use Cleanroom Foggers.
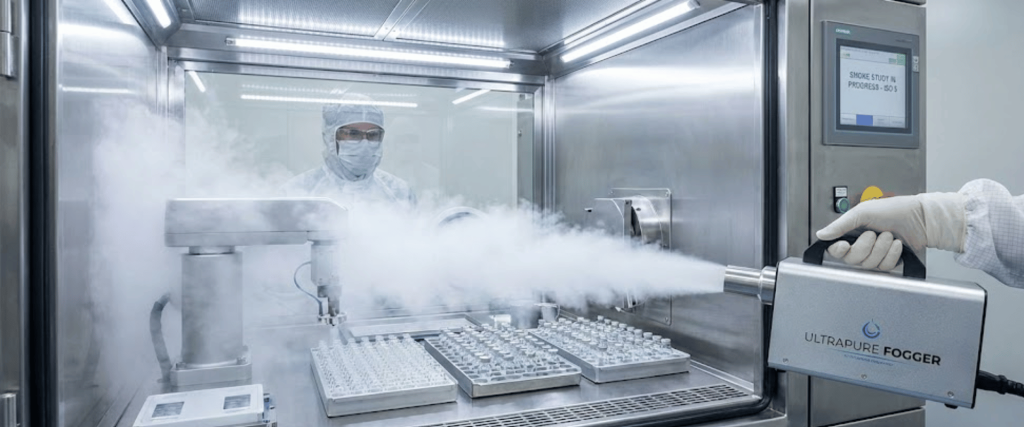
These devices generate a highly visible, ultrapure fog that acts as a surrogate for the VHP vapor. By releasing this fog into the isolator, engineers can:
Not all fog is created equal. For a valid scientific study in a critical ISO 5 environment, the fog must be:
Modern solutions, such as Portable Cleanroom Foggers (like the CRF4 or CRF6), utilize ultrasonic piezo technology or liquid nitrogen to generate this specific type of fog.
These devices allow for adjustable fog volume and velocity, enabling engineers to match the fog output to the specific volume of the isolator or RABS.
The science of VHP distribution is a complex interplay of thermodynamics and fluid mechanics. Acknowledging that injection does not equal distribution is the first step toward robust sterility assurance.
By utilizing high-purity airflow visualization tools to map and validate these patterns, pharmaceutical manufacturers can ensure their isolators are not just running a cycle, but truly achieving decontamination.
Poor distribution is often caused by irregular airflow patterns, turbulence, or physical obstructions like glove ports and equipment. These issues create dead zones where the sterilant vapor cannot penetrate, potentially leaving surfaces non-sterile.
The most effective way to identify dead zones is through Airflow Visualization Studies (smoke studies). By using a portable cleanroom fogger to release a visible vapor, you can track air movement and visually confirm where the VHP is and isn’t reaching.
Ultrapure fog is essential because it is neutrally buoyant and does not leave residue. Unlike glycol or oil-based fogs, it accurately represents the airflow without contaminating the ISO 5 environment or requiring a deep cleaning after the test.