
Table of Contents
- Why Documenting Airflow Visualization Studies Matters
- 1. Establish a Cleanroom Smoke Study Protocol
- 2. Select and Deploy Neutrally-Buoyant Aerosol Streams
- 3. Implement Video Recording and Real-Time Monitoring
- 4. Create an Airflow Visualization Report Template
- 5. Document Intervention Assessments and Personnel Movement
- 6. Apply FDA Guidance on Aseptic Processing Airflow
- 7. Conduct Airflow Visualization Video Analysis
- Troubleshooting Failed Documentation Studies
- Conclusion
- Frequently Asked Questions
Last Updated: August 31, 2026
Why Documenting Airflow Visualization Studies Matters
Cleanroom validation depends on proof that your airflow patterns actually work. A cleanroom smoke study isn’t just a checkbox for auditors, it’s the foundation of your contamination control strategy. Without proper documentation, you have no evidence that critical zones stay protected, personnel movements don’t compromise sterility, or your facility meets regulatory standards.
Most facilities document these studies poorly: they capture footage, fill out a form, and file it away. Then an auditor asks a specific question about Zone B on Day 2, and they can’t answer it. This guide covers seven documentation methods that hold up under scrutiny, creating a comprehensive record that proves your airflow visualization studies meet FDA guidance on aseptic processing airflow, and USP standards for controlled environments.
1. Establish a Cleanroom Smoke Study Protocol
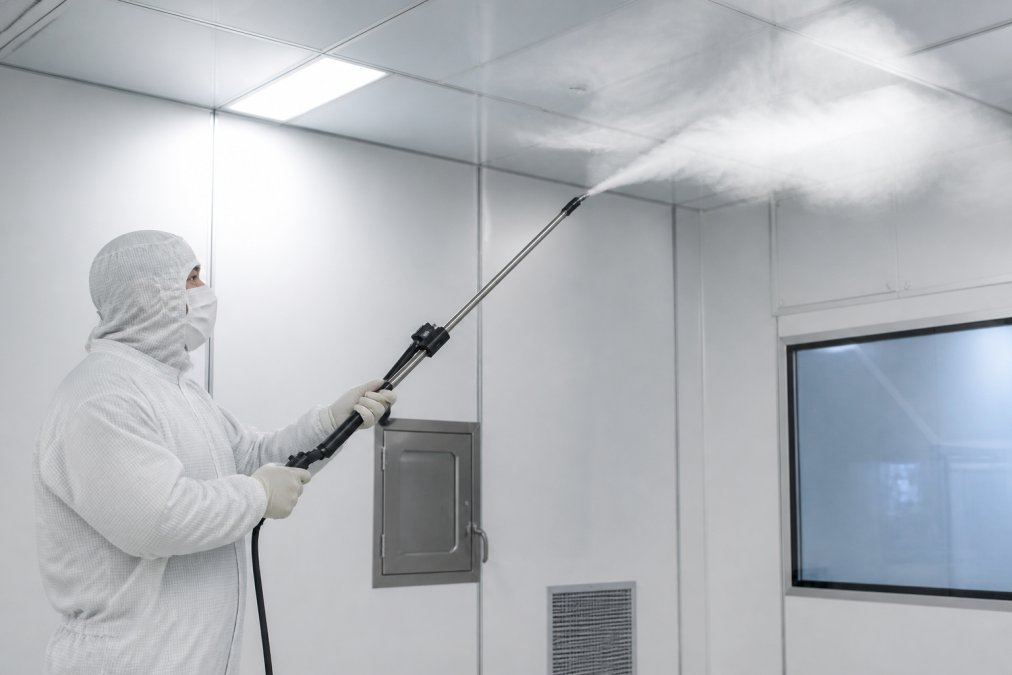
Your documentation starts before the smoke generator turns on. A cleanroom smoke study protocol is your operational blueprint, it specifies exactly what you’re testing, how you’ll test it, and what constitutes success or failure.
The protocol should name your critical zones explicitly with specific coordinates and heights. Specify which intervention assessments you’ll conduct: personnel movement, door openings, equipment placement, gowning procedures. Define baseline airflow conditions before deployment: room pressurization, air exchange rates, and temperature. Document your smoke generator type, output settings, fog volume, duration, and deployment points precisely.
Include acceptance criteria in your protocol. Define what successful airflow visualization looks like numerically: laminar flow maintains unidirectional airflow at 0.3 to 0.5 m/s, turbulent zones show visible swirling, critical zones show no backflow toward personnel or product contact surfaces (the FDA). Store your protocol in your quality management system before running the study, creating an audit trail proving you planned the study rather than improvised it.
2. Select and Deploy Neutrally-Buoyant Aerosol Streams
Neutrally-buoyant aerosol streams behave like air itself, following airflow patterns without sinking or rising due to density differences. Non-neutral fog gives false data: heavy fog sinks and shows patterns that don’t exist in normal operation; light fog rises and misses low-level contamination risks.
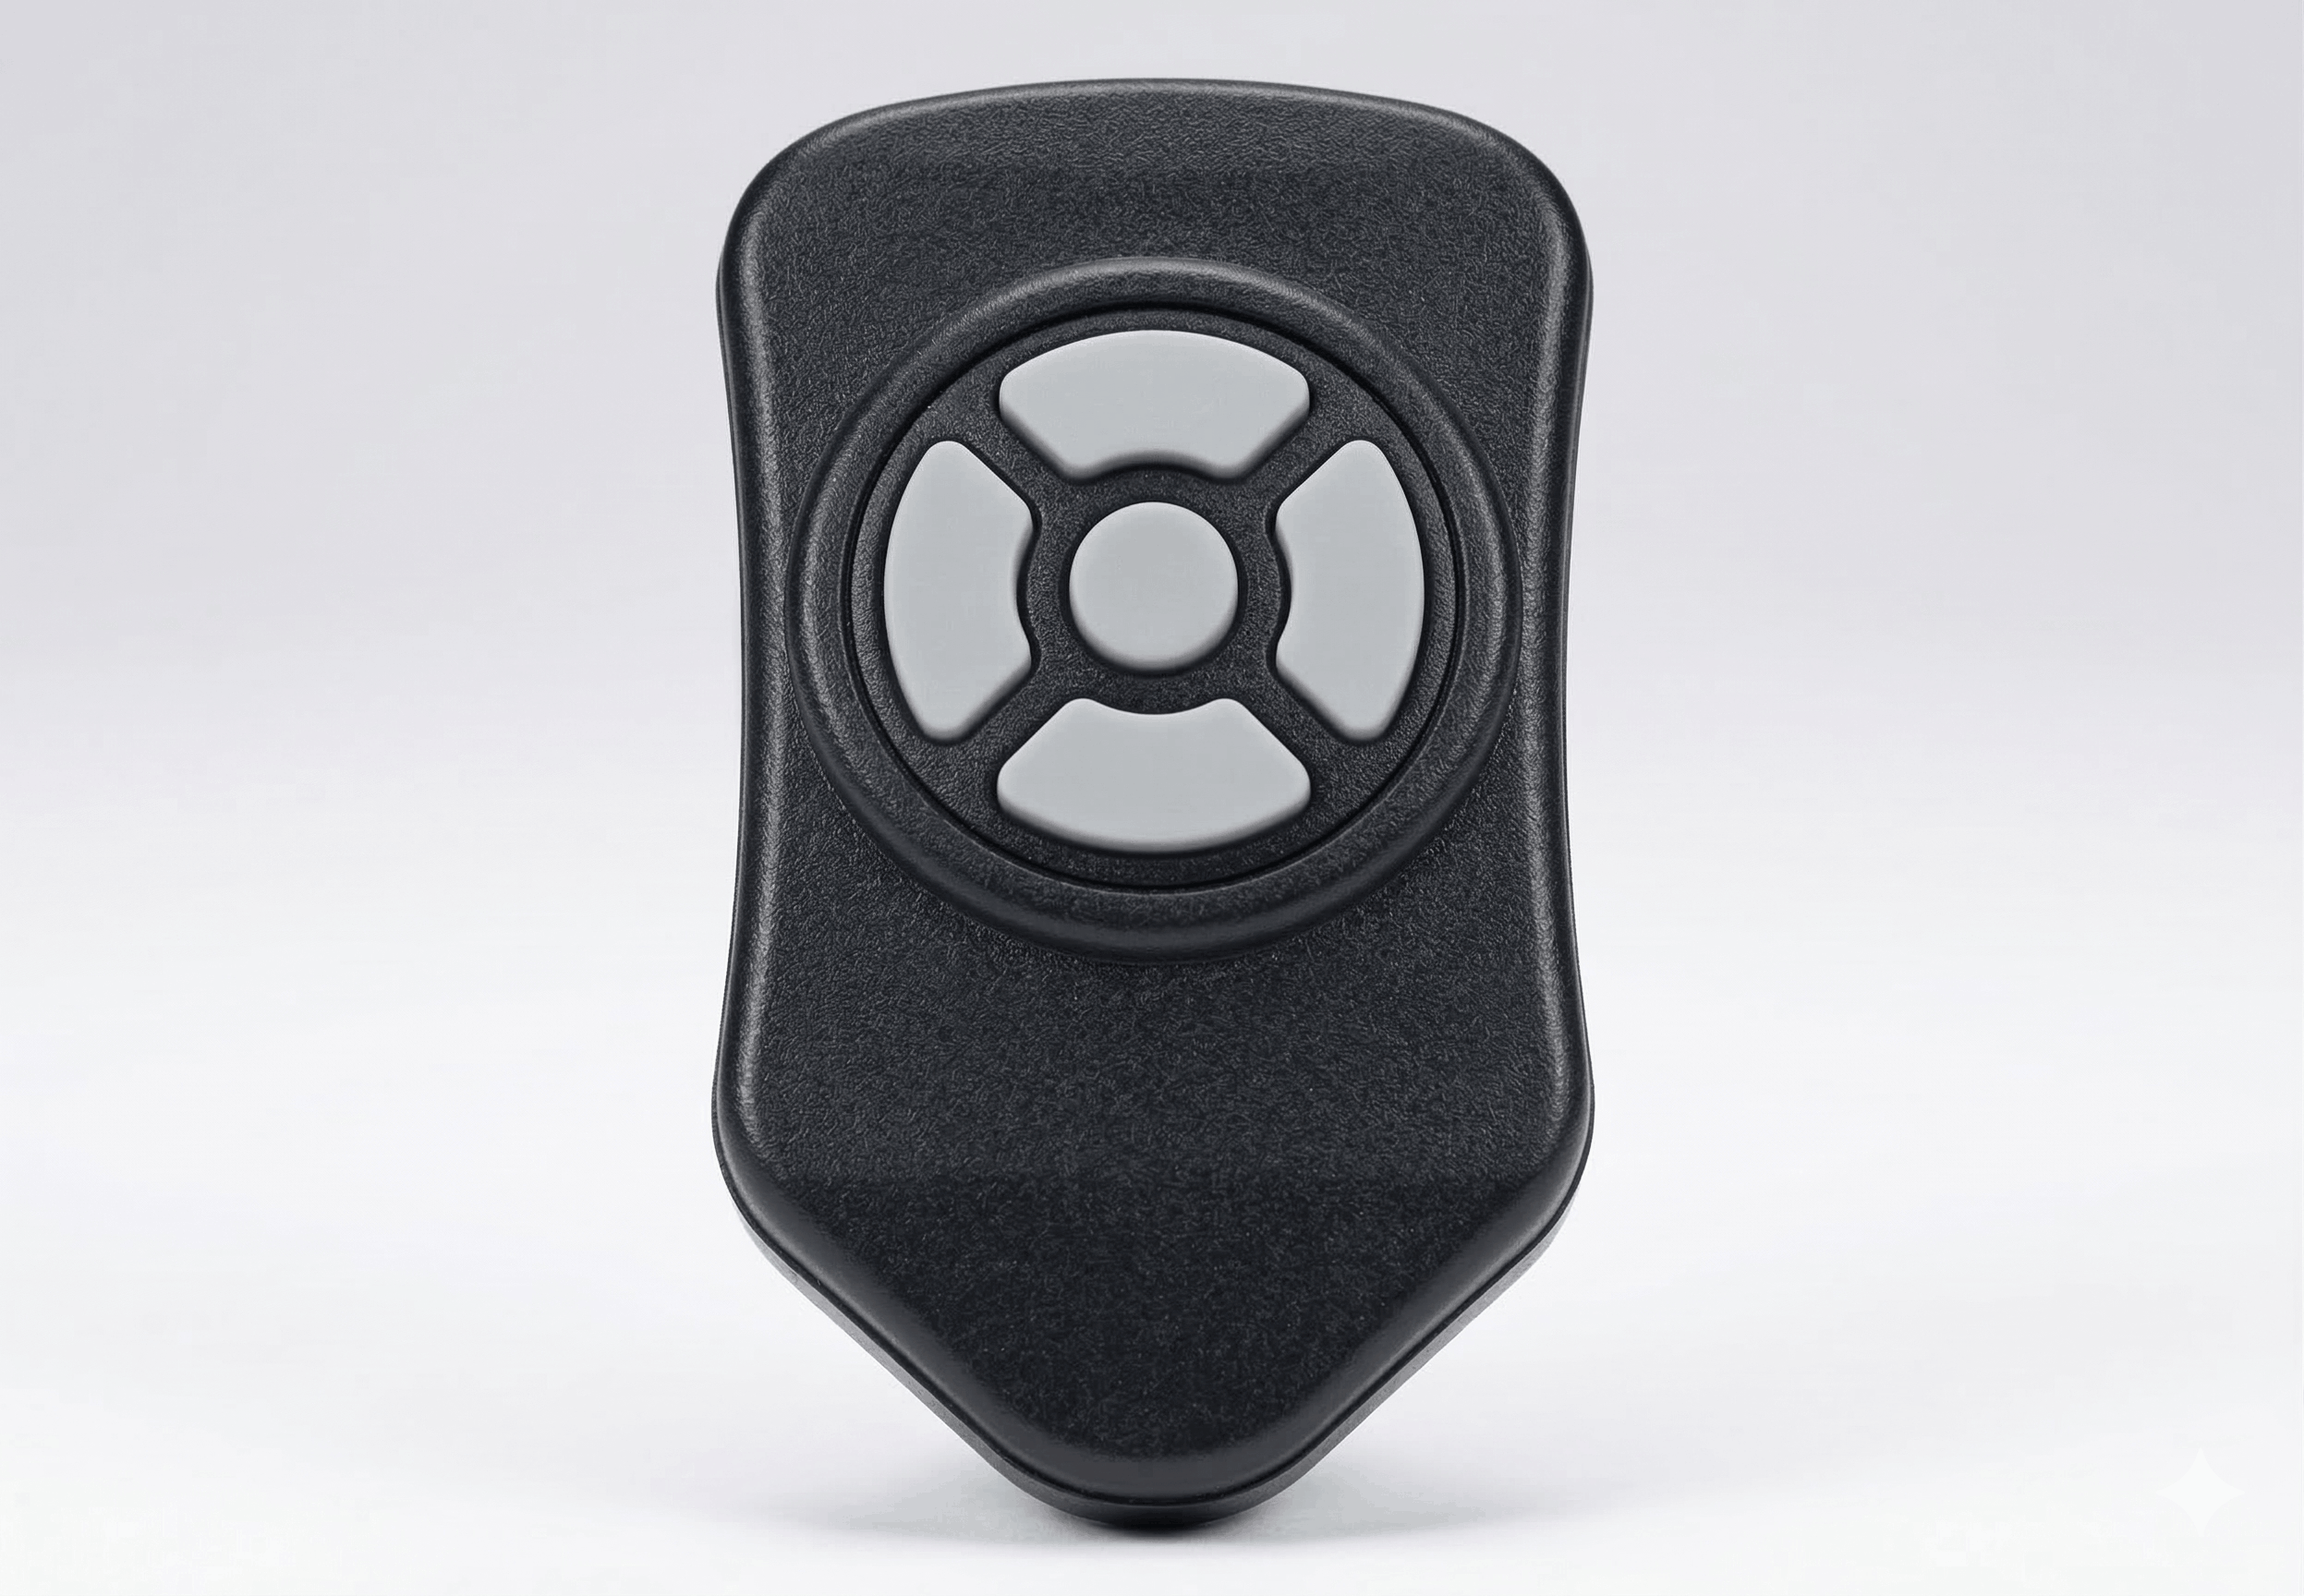
Applied Physics offers both LN2 ultrapure and ultrasonic cleanroom foggers designed to produce neutrally-buoyant output. Ultrasonic foggers generate finer particles that remain suspended longer, giving more observation time. LN2 systems produce consistent, controlled fog volume adjustable via wireless remote control for precise velocity mapping.
Your documentation should specify which fog generation method you used and why. Record the fog concentration deployed, how long it remained visible in each zone, and whether aerosol dispersed uniformly or concentrated in specific areas. Deploy fog from multiple points if your protocol requires it, documenting each deployment point, time of release, and observed behavior. Your written protocol should reference video timestamps where each deployment appears.
3. Implement Video Recording and Real-Time Monitoring
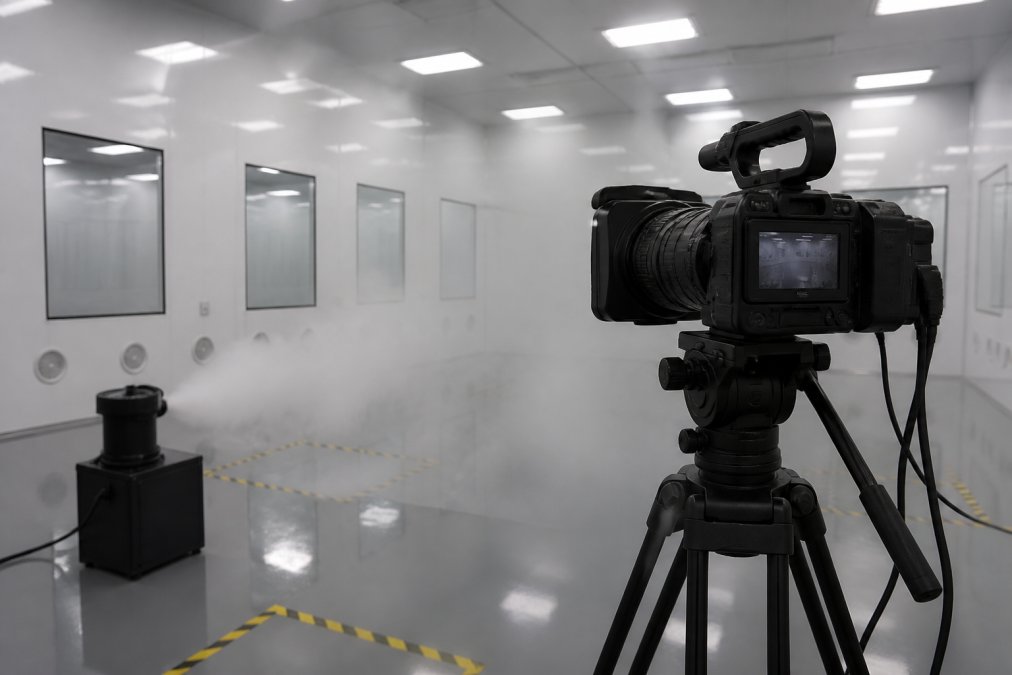
Video documentation transforms a smoke study from subjective observation into objective evidence. Position your camera on a fixed tripod to capture the entire critical zone, avoiding handheld work that introduces motion artifacts. Document the camera position: specific coordinates, height, angle, and distance from the zone.
Ensure adequate lighting with LED supplementation to highlight fog movement without creating glare. Record continuously during entire smoke deployment, including pre-deployment baseline, fog generator activation, dispersal period, and post-deployment clearing. Use minimum 1080p resolution at 30 fps or higher (usp.org).
Label video files with date, time, zone identifier, and protocol version in both filename and metadata. Store videos in standard codecs (H.264 or higher) that maintain integrity over time. Have a second person observe fog behavior live while recording, documenting real-time observations that provide context for later analysis.
4. Create an Airflow Visualization Report Template
Your template should start with study identification: facility name, zone tested, protocol version, date, time, personnel, and equipment used. Include environmental conditions: room temperature, humidity, differential pressure, air exchange rate.
Create sections for visual observations describing what smoke showed: laminar patterns, swirling, turbulence, stagnant zones, obstruction patterns, and whether fog moved toward or away from critical product contact surfaces. Include intervention assessment results documenting what happened when personnel moved through zones, doors opened, or equipment was repositioned. Add a section for personnel movement effects, recording whether gowning practices, hand positioning, or body movement created turbulence or obstruction.
Include a comparison section if this study follows a previous one, noting whether airflow patterns remained consistent. Document deviations or unexpected observations explicitly. End with a clear conclusion: Does the study demonstrate that your cleanroom meets design specifications? Does it prove critical zones remain protected during normal operations?
| Documentation Element | Purpose | Required Detail |
|---|---|---|
| Study Identification | Traceability | Zone, date, protocol version, personnel |
| Environmental Conditions | Context | Temperature, humidity, pressure, air exchange rate |
| Visual Observations | Core Evidence | Airflow patterns, turbulence, obstruction, fog behavior |
| Intervention Assessments | Operational Reality | Personnel movement, door opening, equipment effects |
| Velocity Mapping | Flow Verification | Unidirectional airflow confirmation, speed measurements |
| Deviation Log | Transparency | Any deviations from protocol, their impact |
| Conclusion | Regulatory Compliance | Pass/fail determination with supporting rationale |
5. Document Intervention Assessments and Personnel Movement
Intervention assessments prove your cleanroom works under real operating conditions. Define exactly what interventions you tested: a single gowned operator entering the zone, moving to a specific location, performing a simulated filling operation, and exiting. Document operator positioning, hand movements, and proximity to product contact surfaces.
Use video documentation to capture each intervention from multiple angles if possible. Document what smoke visualization showed: whether the aerosol stream remained undisturbed, showed deflection around the operator’s body, created backflow toward sterile surfaces, or generated turbulence that disrupted airflow patterns. Record time duration for each intervention, as auditors want to know whether short-term interventions differ from sustained operations.
Include observations about gowning effectiveness: Did the operator’s gown create obstruction? Did hood positioning affect airflow? Document any unexpected personnel movement effects. Compare intervention results to baseline airflow patterns, noting whether critical zones remained protected or whether interventions compromised them, and whether zones recovered quickly when interventions ended.
6. Apply FDA Guidance on Aseptic Processing Airflow
FDA guidance requires cleanrooms to maintain unidirectional airflow in aseptic processing zones (the FDA). Your documentation should prove that aerosol moves consistently in one direction, typically downward in Class 100 (ISO Class 5) zones, without swirling, backflow, or stagnation.
FDA guidance requires validation under worst-case conditions. Document whether your cleanroom maintains protection when personnel are present, equipment is operating, and doors are opened for material transfer. Address critical zones explicitly, proving they remain protected and documenting how interventions affect them.
Your documentation must be traceable and reproducible, detailed enough that another qualified person could repeat the study and achieve similar results. Include how you addressed potential contamination pathways, showing that no routes exist from personnel, equipment, or facility surfaces toward critical zones. Reference specific FDA guidance documents in your documentation, demonstrating understanding of regulatory requirements.
7. Conduct Airflow Visualization Video Analysis
Review the entire recording at normal speed, noting timestamps where significant events occur: fog generator activation, intervention assessments, personnel movement, unexpected behaviors. Create a timeline document referencing these timestamps.
Slow-motion review at 50% or 25% speed reveals details normal-speed playback misses. Document slow-motion observations separately from real-time observations. Use video analysis software if available to measure airflow velocity, quantify turbulence intensity, or track aerosol dispersion patterns. Document the software name, version, and methodology.
Measure airflow velocity from video by tracking how far smoke travels in a known time period, comparing results to facility design specifications. Create annotated screenshots marking critical zones, airflow direction, obstruction points, and intervention effects. Document any video quality issues affecting interpretation.
Compare video analysis results to written real-time observations. Generate a video analysis summary document that auditors can review without watching the full video, including key observations, measurements, timestamps, and conclusions.
Troubleshooting Failed Documentation Studies
If smoke visualization showed unexpected turbulence or obstruction, document exactly where and when it occurred. Use video footage to identify the specific cause: personnel movement, equipment positioning, architectural features, or inadequate airflow supply.
If your fog generator malfunctioned, document the malfunction, when it occurred, how you responded, and whether it invalidated the study. If environmental conditions shifted unexpectedly, document these shifts and their timing, correlating them with airflow pattern changes.
If intervention assessments revealed unexpected contamination pathways, document them thoroughly. Auditors respect facilities that identify problems and fix them. If video analysis revealed details contradicting real-time observations, investigate the discrepancy and document your conclusion about which observation was more accurate. Update your report template to prevent systematic documentation gaps from recurring.
Conclusion
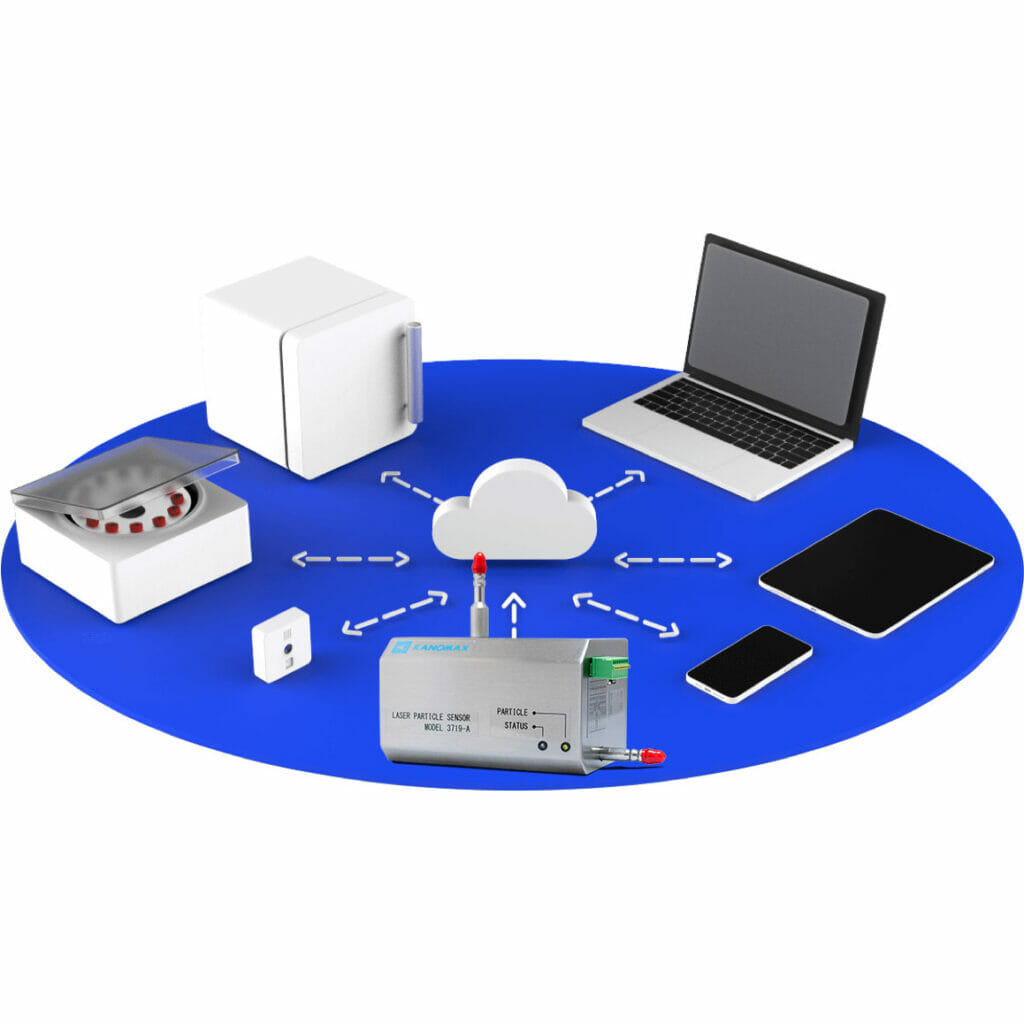
Documenting airflow visualization studies correctly means building a complete record that proves your cleanroom protects your product. Applied Physics has supported this process since 1992 by providing cleanroom foggers, particle counters, and monitoring systems that generate reliable data. Our wireless remote control technology for fog generators lets you adjust aerosol output precisely during studies. Our cleanroom monitoring systems capture environmental conditions that contextualize your airflow patterns.
The seven documentation methods covered here, establishing protocols, selecting proper visualization media, recording video evidence, creating standardized templates, documenting interventions, applying regulatory guidance, and analyzing results thoroughly, transform smoke studies into genuine operational intelligence. They create audit trails that satisfy regulators and give you confidence that critical zones truly remain protected.
Contact Applied Physics today to discuss how our airflow visualization equipment and monitoring solutions can support your cleanroom validation program.
Frequently Asked Questions
Q: What is the purpose of an airflow visualization study in a cleanroom?
A: Airflow visualization studies confirm that laminar flow and unidirectional airflow patterns protect critical zones from contamination. By using neutrally-buoyant aerosol streams (smoke), you can observe how air moves through the cleanroom, identify turbulence or dead zones, and verify that personnel movement and interventions do not compromise aseptic conditions. Documentation of these studies is required for GMP compliance and FDA audits.
Q: How do you document smoke studies for FDA compliance?
A: FDA guidance on aseptic processing airflow requires written protocols, video recording of the study, photographs of critical zones, and a comprehensive report documenting airflow patterns, intervention assessments, and any deviations. Your cleanroom smoke study protocol must detail equipment used (fog generator type, aerosol characteristics), personnel involved, dates, and interpretation of results. Store all video and photographic evidence with timestamps and maintain records for regulatory inspection.
Q: What equipment is essential for documenting airflow visualization studies?
A: Core equipment includes a smoke generator (LN2 ultrapure or ultrasonic type), a wireless remote control for fog volume adjustment, video camera with stable mounting, lighting for visibility, and monitoring devices like particle counters or microbial air samplers. Support arms or rod extenders help reach elevated ceiling zones without operator fatigue. The Cleanroom Monitoring System (Model CRMS) provides continuous environmental data that correlates with your smoke study observations.
Q: How often should airflow visualization studies be performed?
A: Initial validation is required before production starts, then requalification is typically performed annually or after significant changes (equipment relocation, gowning procedure changes, or personnel movement patterns). If your facility experiences failed studies or identifies critical zone vulnerabilities, repeat the study after corrective action. Document the frequency and rationale in your cleanroom smoke study protocol and maintain a schedule for regulatory audits.
