
Table of Contents
- Understanding the Cost Impact of Cleanroom Validation Downtime
- Step 1: Implement Predictive Maintenance and Performance Tracking
- Step 2: Optimize HVAC Systems and Energy Consumption
- Step 3: Deploy Room-Side Replaceable (RSR) Filter Technology
- Cleanroom Airflow Visualization Techniques for Faster Validation
- Step 4: Use a Risk-Based Approach to Calibration and IQ/OQ/PQ
- Cleanroom Validation Timeline: Planning for Regulatory Compliance
- ISO 14644-1 Compliance Checklist for Simplified Operations
- Step 5: Invest in Modular Cleanroom Design and Digital Twin Technology
- Frequently Asked Questions
Last Updated: October 1, 2026
Understanding the Cost Impact of Cleanroom Validation Downtime
Unplanned cleanroom validation downtime costs your operation $125,000 per hour, according to iFactoryApp’s 2026 manufacturing downtime benchmarks. That’s not a typo. One hour of unexpected shutdown drains six figures from your bottom line. For pharmaceutical manufacturers, semiconductor fabs, and biotech facilities, cleanroom validation downtime isn’t just an operational hiccup, it’s a financial crisis that compounds daily.
The real problem: most teams treat validation as a one-time checkbox rather than an ongoing cost-control system. Organizations that reduce cleanroom validation downtime costs through proactive systems save millions annually, while those that react to failures hemorrhage cash.
Cleanroom validation downtime involves regulatory re-qualification. You can’t just restart equipment, you must re-run IQ/OQ/PQ protocols, document everything for compliance, and prove the environment is safe. A single unplanned shutdown can trigger 2-3 weeks of re-validation work, during which production stays offline.
The cost breakdown tells the story. Beyond the $125,000 hourly impact, unplanned production shutdowns in cleanrooms can cost between $20,000 and $100,000 per day in re-validation and regulatory documentation, according to CleanroomEquips industry analysis. Add lost product batches, expedited shipping to meet customer commitments, and regulatory fines for missed compliance deadlines, and the total damage becomes staggering.
But here’s what most guides miss: the solution isn’t spending more on equipment. Strategic planning and specialized construction can reduce operational downtime by up to 60% compared to traditional approaches, according to Trotek’s cleanroom construction optimization research. That means taking control of downtime before it happens.
Step 1: Implement Predictive Maintenance and Performance Tracking
Prevent cleanroom validation downtime by stopping failures before they occur. Predictive maintenance uses real-time sensor data to identify problems weeks before they become critical.
AI-native Reliability Centered Maintenance (RCM) can slash unplanned downtime by 30-50%, according to Oxmaint’s predictive maintenance impact analysis. This isn’t theoretical. Engineers are increasingly using performance data to flag inefficiencies before failures occur, minimizing both downtime and the validation work that follows.
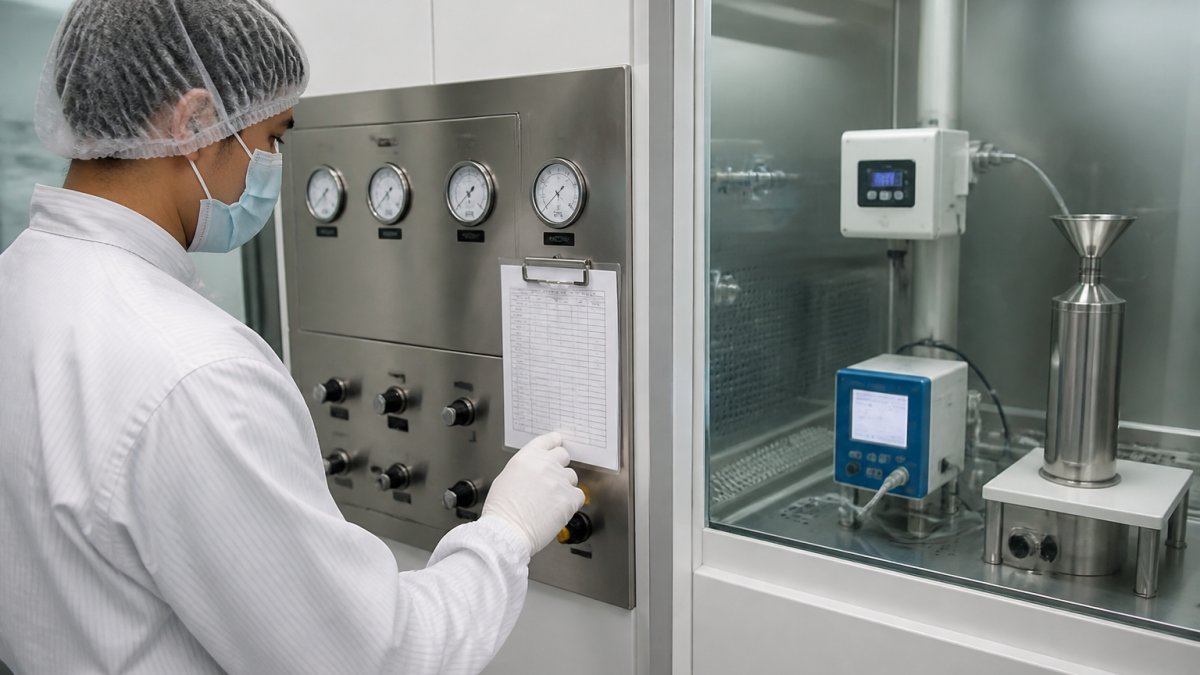
Here’s how to implement this:
- Install continuous monitoring sensors on critical equipment (HVAC units, filter banks, pressure differentials)
- Set alert thresholds based on historical performance data, not just manufacturer specs
- Track particle counts hourly, not just during formal validation cycles
- Log temperature and humidity drift before it triggers re-validation requirements
- Schedule maintenance during planned downtime, not during production runs
One pharmaceutical manufacturer using performance tracking reduced unplanned shutdowns by 40% in six months by scheduling maintenance proactively and avoiding re-validation cascades.
Step 2: Optimize HVAC Systems and Energy Consumption
Your HVAC system is the heart of cleanroom operations. When it drifts out of spec, you lose validation status and face re-qualification costs. Optimizing airflow prevents the downtime that triggers expensive re-validation cycles.
Cleanroom airflow velocity should be maintained in the range of 0.30-0.33 m/s to effectively control particle contamination while preserving airflow efficiency, according to research published in Aerosol and Air Quality Research (AAQR). This narrow window is where contamination control and energy efficiency intersect. Drift outside this range and you’re either wasting energy or risking contamination that forces re-validation.
Optimize your HVAC system using these steps:
- Measure actual airflow velocity at multiple points, not just the design spec
- Replace filters on a predictive schedule, not a calendar-based one
- Balance supply and exhaust air to maintain consistent pressure differentials
- Install variable frequency drives (VFDs) on fan motors to reduce energy waste during low-demand periods
- Conduct quarterly airflow audits to catch drift before it becomes a compliance issue
Step 3: Deploy Room-Side Replaceable (RSR) Filter Technology
Traditional filter replacement requires shutdown and full re-validation, hours of downtime plus weeks of compliance work. Room-side replaceable (RSR) filter technology eliminates this bottleneck.
RSR units allow filter changes inside the cleanroom without breaking containment. No shutdown. No re-validation trigger. Just maintenance during normal operations.
The mechanics are simple but powerful:
- RSR filters seal inside a housing that prevents particle escape during replacement
- Technicians change filters without stopping airflow to the rest of the cleanroom
- No re-entry of outside air means no contamination event
- Compliance documentation is minimal because you never broke cleanroom integrity
One biotech facility switching to RSR filters reported 35% reduction in unplanned validation cycles within the first year.
Cleanroom Airflow Visualization Techniques for Faster Validation
Validation downtime depends on how quickly you prove cleanroom performance meets specification. Airflow visualization techniques compress timelines by providing direct evidence of airflow patterns and dead zones before formal particle sampling, accelerating protocol execution and reducing re-qualification cycles.
There are three primary visualization approaches, each with distinct advantages for validation acceleration:
Smoke Testing (Qualitative Airflow Visualization)
Smoke testing uses visible tracer particles to show airflow patterns in real time. Technicians release smoke at key points and observe movement, revealing dead zones or backflow that particle counters might miss.
FDA and ISO 14644-1 guidance accept smoke testing as supporting evidence for airflow qualification. One pharmaceutical facility reduced OQ downtime by 2 weeks using smoke testing before running full particle count protocols.
Limitations: Smoke testing is qualitative, not quantitative. It shows direction but not precise velocity. It also requires cleanroom shutdown during the test (smoke cannot be present during product operations), so it must be scheduled during planned downtime.
Particle Tracer Dispersion Modeling
This method releases neutrally buoyant tracer particles at a known location and tracks movement using particle counters at multiple points. Unlike smoke, tracer particles behave like actual contamination.
Particle tracer studies provide quantitative data on contamination transport and settling rates, supporting PQ protocols. Facilities using tracer modeling can justify risk-based sampling strategies that reduce PQ monitoring by 30-40% without sacrificing compliance.
Implementation: Release tracer particles during a controlled, non-production period. Measure particle concentration at 5-10 locations over 30-60 minutes. Plot concentration decay curves. Use this data to set realistic acceptance criteria for your specific cleanroom geometry and airflow pattern.
Computational Fluid Dynamics (CFD) Simulation and Digital Twin Validation
CFD modeling creates a virtual 3D model and simulates airflow, particle transport, and contamination before physical validation. This allows you to test scenarios and predict failure modes without touching the real facility.
Before running IQ/OQ/PQ, engineers simulate the cleanroom under different conditions. The simulation reveals vulnerable areas and optimal particle counter positions. When you move to physical validation, you already know what to expect, making failed validations rare.
FDA and PDA guidance increasingly accept CFD-supported validation protocols. The simulation becomes part of compliance documentation, reducing extended monitoring periods because the design is already proven sound.
Facilities using CFD-supported validation report 25-35% reduction in total validation time: sampling locations are optimized, acceptance criteria are realistic, unexpected failures are rare, and re-validation cycles are faster.
Integrating Visualization into Your Validation Protocol
The most efficient approach combines all three methods in sequence:
- Pre-validation phase (smoke testing): Identify gross airflow patterns and obvious dead zones. Takes 1-2 days. Cost: minimal.
- Design phase (CFD simulation): Model the cleanroom and predict performance under various scenarios. Identifies optimal sampling locations and realistic acceptance criteria. Takes 2-4 weeks but prevents months of failed validation cycles later.
- Execution phase (particle tracer and formal particle counting): Run OQ and PQ with confidence that airflow is understood. Monitoring duration can be shortened because you’ve already proven the design works.
This phased approach redistributes validation effort from expensive execution (where downtime costs $20,000-$100,000 per day) to cheap planning. The result is faster validation, fewer re-qualification cycles, and predictable downtime.
Documentation and Compliance
All visualization data must be documented in your validation protocol and kept in your compliance file. Photographs of smoke patterns, CFD simulation reports, and particle tracer data all serve as supporting evidence that your cleanroom airflow meets specification. This documentation accelerates future regulatory audits because you have direct evidence of how your cleanroom performs, not just particle counts at specific points in time.
Step 4: Use a Risk-Based Approach to Calibration and IQ/OQ/PQ
Most protocols treat all equipment equally, wasting resources on low-risk items. A risk-based validation strategy focuses resources where they matter most, reducing validation downtime by 30-45% without compromising compliance.
Risk-based validation is endorsed by FDA guidance and ICH Q14 approaches. Validation effort should be proportional to risk: high-risk parameters get comprehensive validation; low-risk parameters get streamlined protocols.
Classifying Cleanroom Parameters by Risk
Start by categorizing every parameter in your cleanroom validation into three risk tiers:
Tier 1: Critical Parameters (Full Validation Required)
Portable Particle Counter Validation, IQ/OQ →
These directly impact product safety or contamination control. Failure of a Tier 1 parameter compromises the entire cleanroom.
- HVAC airflow velocity and direction (0.30-0.33 m/s for ISO Class 5; 0.15-0.30 m/s for ISO Class 7)
- Differential pressure between cleanroom and adjacent spaces (minimum 0.02 inches water column)
- Particle count at critical locations (ISO Class 5 = ≤3,520 particles ≥0.5 micron per cubic foot)
- Temperature and humidity control (typically ±2°C and ±5% RH for pharmaceutical cleanrooms)
- HEPA/ULPA filter integrity (DOP testing per MIL-STD-282 or equivalent)
- Pressure decay rate (measures cleanroom envelope integrity)
For Tier 1 parameters:
- Run full IQ/OQ/PQ protocols
- Establish acceptance criteria based on design intent and regulatory requirements
- Monitor continuously or at defined intervals during production
- Conduct re-validation after any maintenance or equipment change
- Document all results in your compliance file
Tier 2: Important Parameters (Abbreviated Validation)
These support cleanroom operations but aren’t directly tied to product safety. Failure is detectable and correctable without product loss.
- Secondary temperature sensors (redundant to primary control)
- Humidity monitoring in non-critical zones
- Door interlock functionality
- Visual inspection of cleanroom surfaces and seals
- Lighting and electrical systems
- Personnel gowning room conditions
For Tier 2 parameters:
- Run abbreviated OQ/PQ (simplified protocols, shorter monitoring periods)
- Acceptance criteria can be less stringent than Tier 1
- Annual re-validation or after major maintenance
- Documentation can be streamlined (summary reports instead of detailed protocols)
Tier 3: Supporting Parameters (Simplified Verification)
These are operational conveniences or redundant systems. Failure has minimal impact on product quality.
- Cable management and labeling
- Equipment serial number documentation
- Maintenance log organization
- Non-critical alarm systems
- Cosmetic cleanroom condition
For Tier 3 parameters:
- Visual inspection and documentation only
- No formal testing required
- Annual verification sufficient
- Minimal documentation
Implementing Risk-Based IQ/OQ/PQ Protocols
Once you’ve classified parameters, design your validation protocols accordingly:
Installation Qualification (IQ) – Risk-Based Approach
- Tier 1 equipment: Full IQ including equipment specifications, installation drawings, calibration certificates, and as-built verification. Duration: 2-3 weeks.
- Tier 2 equipment: Abbreviated IQ with equipment verification and basic installation checks. Duration: 1 week.
- Tier 3 equipment: Visual inspection and documentation only. Duration: 1-2 days.
Operational Qualification (OQ) – Risk-Based Approach
- Tier 1 systems: Comprehensive OQ testing under normal and stress conditions (e.g., HVAC tested at 80%, 100%, and 120% design airflow). Monitoring duration: 2-4 weeks. Acceptance criteria: tight tolerances (±5% of specification).
- Tier 2 systems: Standard OQ testing under normal conditions only. Monitoring duration: 1-2 weeks. Acceptance criteria: ±10% of specification.
- Tier 3 systems: Functional verification only. Monitoring duration: 1-3 days. Acceptance criteria: operational or non-operational.
Performance Qualification (PQ) – Risk-Based Approach
- Tier 1 parameters: Full PQ with product present (or product simulation). Particle counting at 10+ locations, multiple sampling periods, contamination challenge testing. Duration: 4-6 weeks.
- Tier 2 parameters: Abbreviated PQ with reduced sampling locations (5-7 points) and shorter monitoring periods (2-3 weeks).
- Tier 3 parameters: No formal PQ required; operational verification sufficient.
Real-World Example: Pharmaceutical Cleanroom
A pharmaceutical facility manufacturing sterile injectables classified their cleanroom parameters as follows:
- Tier 1: HVAC airflow, differential pressure, particle count, HEPA filter integrity, temperature/humidity in ISO Class 5 zone
- Tier 2: Secondary temperature sensors, gowning room conditions, door interlocks
- Tier 3: Lighting, cable management, cosmetic condition
Using risk-based validation, they reduced total validation time from 16 weeks to 10 weeks:
- IQ: 3 weeks (down from 4 weeks), focused effort on Tier 1 equipment
- OQ: 3 weeks (down from 4 weeks), abbreviated testing for Tier 2 systems
- PQ: 3 weeks (down from 6 weeks), optimized sampling locations based on risk assessment
- Documentation: 1 week (down from 2 weeks), streamlined reporting for low-risk items
Total downtime reduction: 6 weeks per validation cycle. Over a 5-year period with annual re-validation, this facility saved 30 weeks of downtime, equivalent to $30-$60 million in avoided production losses (at $125,000 per hour).
Regulatory Acceptance and Audit Readiness
Risk-based validation is fully compliant with FDA and ICH guidance. When auditors review your protocol, you can explain your risk classification and justify why certain parameters received abbreviated validation. This transparency actually strengthens your compliance posture because it demonstrates that you understand your process and have made deliberate, documented decisions about validation scope.
Key documentation for audit readiness:
- Risk assessment matrix (parameter, risk tier, justification)
- Validation protocol with risk-based scope clearly stated
- Acceptance criteria linked to product safety and regulatory requirements
- Summary of how Tier 1, 2, and 3 parameters were validated
- Rationale for any deviations from standard protocols
Phased Validation Across Quarters
Risk-based validation also enables phased re-qualification. Instead of shutting down the entire cleanroom for validation, you can validate Tier 1 systems in Q1, Tier 2 systems in Q2, and Tier 3 systems in Q3. This distributes downtime across the year and allows partial operation during maintenance cycles.
Example schedule:
- Q1: HVAC and particle count validation (Tier 1), 2 weeks downtime
- Q2: Temperature/humidity and door interlock validation (Tier 2), 1 week downtime
- Q3: Visual inspection and documentation (Tier 3), 2 days downtime
- Q4: Production and contingency buffer
This approach keeps your facility operational for 90% of the year while maintaining full compliance.
Cleanroom Validation Timeline: Planning for Regulatory Compliance
Understanding the cleanroom validation timeline lets you plan maintenance and avoid surprise downtime. Validation isn’t instant. It requires planning, execution, and documentation.
A typical cleanroom validation timeline looks like this:
| Phase | Duration | What Happens |
|---|---|---|
| Planning & Protocol Development | 2-4 weeks | Define acceptance criteria, prepare documentation |
| Installation Qualification (IQ) | 1-2 weeks | Verify equipment installation and connections |
| Operational Qualification (OQ) | 2-4 weeks | Test equipment performance under normal conditions |
| Performance Qualification (PQ) | 2-6 weeks | Validate cleanroom performance with product present |
| Documentation & Audit | 1-2 weeks | Compile records, prepare for regulatory review |
| Total Timeline | 8-18 weeks | Depends on complexity and risk level |
Planning ahead means you schedule validation during planned downtime windows, not during production crises. That simple shift cuts unplanned downtime costs dramatically.
ISO 14644-1 Compliance Checklist for Simplified Operations
ISO 14644-1 defines cleanroom classification and validation requirements. Meeting this standard is non-negotiable for regulated facilities. But compliance doesn’t have to trigger extended downtime if you stay organized.
Use this ISO 14644-1 compliance checklist to simplify operations:
- Classify your cleanroom by particle count specification (ISO Class 1-9)
- Document airflow velocity and direction at all monitoring points
- Verify temperature and humidity control within specification
- Test differential pressure between adjacent rooms
- Conduct particle count sampling at defined locations and frequencies
- Calibrate all monitoring equipment before each validation cycle
- Train staff on cleanroom entry procedures and contamination control
- Maintain equipment maintenance logs and filter change records
- Conduct annual re-qualification or after any equipment changes
- Prepare audit documentation in advance, not during compliance reviews
This checklist prevents compliance surprises. When you know what’s required and prepare in advance, validation runs smoothly and downtime stays predictable.
Step 5: Invest in Modular Cleanroom Design and Digital Twin Technology
The most advanced facilities use modular cleanroom design combined with digital twin technology to predict performance and prevent downtime before it occurs. This approach requires upfront investment but delivers massive long-term savings.
Modular cleanroom construction offers these advantages:
- Sections can be maintained independently without shutting down the entire facility
- Equipment upgrades happen in phases, spreading validation work across quarters
- Redundant systems provide backup if primary systems fail
- Flexible layout allows production to shift to unaffected areas during maintenance
Digital twin technology creates a virtual model of your cleanroom. Engineers simulate changes before implementing them physically. You test HVAC modifications, filter replacements, and equipment upgrades in the digital model first. When you move to the real cleanroom, you know exactly what will happen. No surprises. No failed validations requiring re-work.
Facilities using digital twins report 25-35% reductions in validation cycles because changes are optimized before execution.
The investment in modular design and digital twin tools pays for itself within 18-24 months through reduced downtime and faster validation cycles.
Reducing cleanroom validation downtime costs isn’t about cutting corners on compliance. It’s about building systems that prevent failures before they happen. Predictive maintenance, optimized HVAC, RSR filters, risk-based validation, and digital twins work together to keep your facility running safely and profitably.
Applied Physics provides precision airflow visualization and particle metrology solutions to accelerate validation cycles and prevent unplanned downtime. Contact Applied Physics to discuss how our cleanroom monitoring and visualization equipment can reduce your validation downtime costs and keep your facility compliant and productive.
Frequently Asked Questions
How does cleanroom validation downtime impact operational costs?
Unplanned production shutdowns in cleanrooms cost between $20,000 and $100,000 per day, with manufacturing downtime averaging $125,000 per hour. For pharmaceutical and semiconductor operations, a single validation failure can trigger re-validation cycles, regulatory documentation requirements, and lost production throughput. Implementing predictive maintenance and optimized validation workflows can reduce these costs by 30-50% through early detection of potential failures.
What are the most common causes of delays during cleanroom validation?
The primary causes include inadequate airflow visualization, inefficient filter replacement procedures, manual calibration errors during IQ/OQ/PQ phases, and unplanned equipment failures. Room-side replaceable (RSR) filter technology eliminates contamination risks during filter changes, while real-time performance tracking identifies inefficiencies before they cause shutdowns. Staff training on proper validation protocols also reduces human error, which accounts for a significant portion of unexpected delays.
How can airflow visualization reduce validation time?
Cleanroom airflow visualization techniques using specialized foggers reveal particle distribution patterns and velocity inconsistencies in real time, allowing engineers to identify contamination control gaps during initial validation rather than discovering them during compliance audits. This approach compresses validation timelines by enabling faster troubleshooting of HVAC optimization issues. Visual confirmation of airflow patterns (typically 0.30-0.33 m/s) accelerates the sign-off process for IQ/OQ phases, reducing overall validation cycles.
What is the role of ISO 14644-1 in streamlining validation?
ISO 14644-1 establishes the classification system and testing requirements for cleanroom environments. A structured ISO 14644-1 compliance checklist ensures your facility meets classification standards without redundant testing. By aligning your validation timeline and calibration procedures to ISO 14644-1 requirements upfront, you avoid re-validation cycles triggered by non-compliance findings. This regulatory alignment reduces downtime caused by audit failures and accelerates facility certification.
