Last Updated: August 23, 2026
Airflow visualization is the qualitative process of observing how air moves through a cleanroom using visible tracer particles, typically smoke or fog, to identify flow patterns, stagnant zones, and directional movement. Particle counting is the quantitative measurement of airborne particulate concentration at specific size thresholds, expressed in particles per cubic centimeter, to verify compliance with ISO 14644-1 standards and contamination control strategy requirements.
These are fundamentally different approaches to cleanroom validation, yet both are essential. Applied Physics has spent over three decades helping manufacturers understand that neither method alone tells the complete story. Smoke studies show you where air is going. Particle counts tell you whether the air quality meets regulatory thresholds. Together, they form the backbone of a defensible contamination control strategy.
The distinction matters because regulatory bodies expect both. A cleanroom might pass particle count thresholds while harboring dead zones that smoke studies would immediately reveal. Conversely, beautiful airflow patterns mean nothing if your particle counts exceed ISO limits. This is where most facilities stumble: they choose one method and assume it’s sufficient.
Understanding when to use each method, and how to integrate their data into a unified contamination control strategy, separates facilities that pass audits from those that face repeat findings. The cost of downtime from validation failures far exceeds the cost of running both tests systematically.
Qualitative testing, represented by airflow visualization, provides visual evidence of air movement patterns but doesn’t measure contamination levels numerically. You see smoke follow a path, observe where it stalls, and identify potential problem areas. Quantitative testing, represented by particle counting, delivers precise numerical data: exactly how many particles of what size exist in the air at any given moment.
The operational difference is stark. A smoke study takes hours and produces visual documentation. Particle counting requires calibrated instrumentation, careful sampling methodology, and statistical analysis. One is observational; the other is measurement-based. Regulators understand this distinction, and your audit trail must reflect it.
Here’s what many facilities miss: qualitative data is reproducible but not quantifiable. Quantitative data is precise but doesn’t show you the mechanism of contamination. A particle counter tells you there are 3,500 particles per cubic centimeter at a location. A smoke study tells you why, because air isn’t reaching that spot, or it’s recirculating contaminated air. Both pieces of information are required for effective contamination control.
Applied Physics works with cleanroom managers who’ve discovered that combining these approaches reveals what either alone would hide. You might see perfect particle counts in one zone while smoke studies reveal that air is being pulled from a high-risk area. That’s the kind of insight that prevents product recalls.
The regulatory expectation is clear: ISO 14644-1 requires qualification through particle counting, while Annex 1 expects visual confirmation of unidirectional airflow through smoke studies. This isn’t redundancy; it’s intentional coverage of different risk vectors. Facilities that treat these as separate exercises often discover mid-audit that their data doesn’t tell a coherent story.
A smoke study, or tracer particle visualization, is a critical validation tool that demonstrates unidirectional airflow and identifies zones where air stagnation or unwanted recirculation might occur. For pharmaceutical manufacturing under Annex 1 and for semiconductor fabrication requiring airflow uniformity verification, smoke studies provide visual evidence that your cleanroom design actually performs as intended.
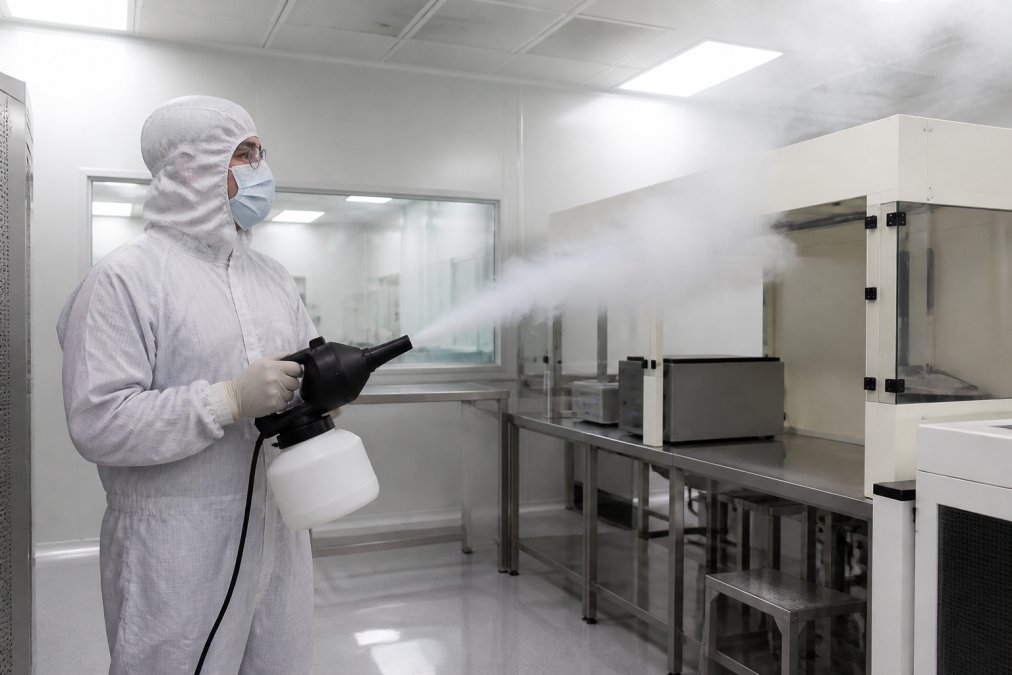
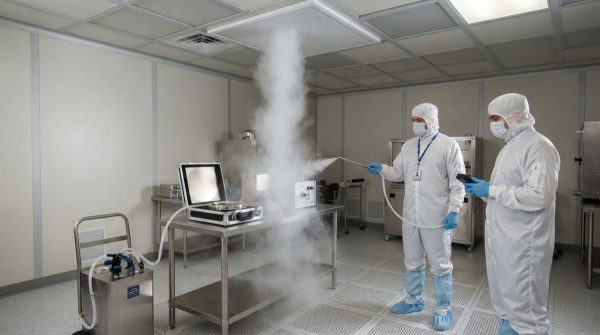
The procedure itself is straightforward but requires discipline. A non-contaminating tracer material, typically a fog generated from mineral oil or water-based solutions, is introduced into the cleanroom at multiple points. Observers then track how that fog moves, documenting its behavior on video or in photographs. The goal is to confirm that airflow is truly unidirectional (either downward from ceiling or horizontal from wall), that it maintains adequate air exchange rates, and that no dead zones exist where particles could accumulate.
Annex 1 requirements specify that smoke studies must be conducted at rest and in operation (europa.eu). At rest means the cleanroom is idle, no personnel, no equipment running, just HVAC systems. In operation means the cleanroom is functioning as it would during actual manufacturing. The difference between these two states often reveals critical insights. A cleanroom might show perfect flow at rest but develop stagnant zones once equipment and personnel are present.
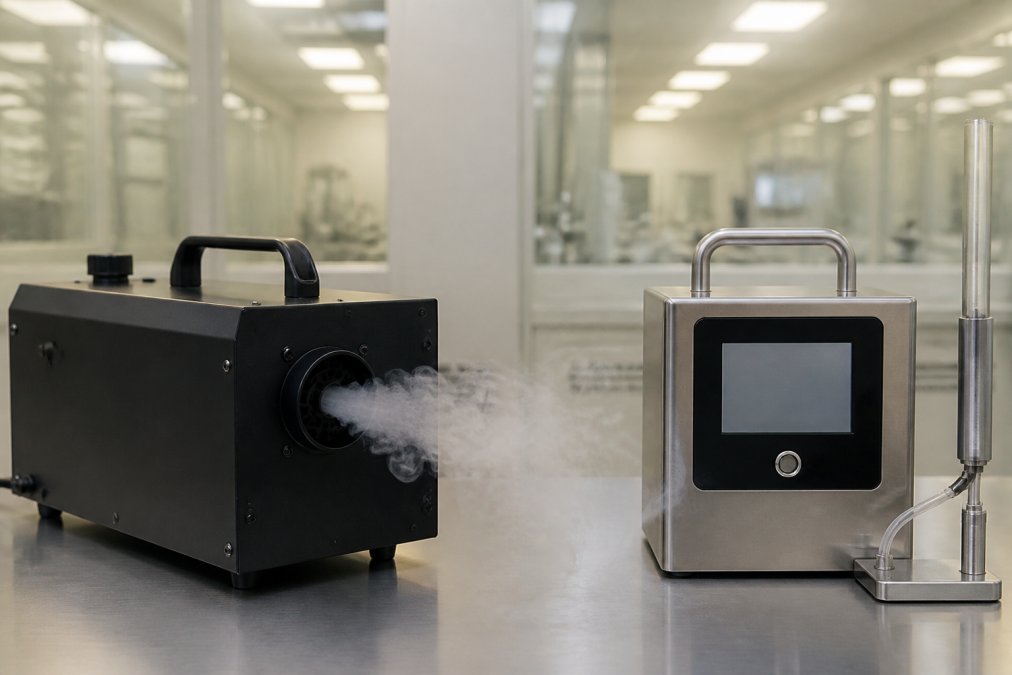
The tracer particles themselves matter more than many facilities realize. Non-contaminating fog is essential because any residue left behind could contaminate your manufacturing environment. Applied Physics cleanroom foggers use ultrapure LN2 or ultrasonic technology specifically to avoid introducing contaminants while creating visible tracer particles. Using the wrong fogger, one that leaves residue or uses questionable materials, can invalidate your study and create compliance headaches.
Recovery time is another critical measurement from smoke studies. This is the time required for introduced tracer particles to clear from the cleanroom after their source is stopped. If recovery time exceeds your design specification, you have a potential contamination control problem. Recovery time directly correlates to your air exchange rate and the effectiveness of your HEPA filtration system.
Documentation is non-negotiable. Regulators expect video recordings, still photographs, timestamps, environmental conditions at the time of the study, and a detailed protocol explaining where tracer particles were introduced and what was observed. Many facilities conduct excellent smoke studies but fail to document them thoroughly enough to satisfy auditors. The study is only valuable if the audit trail is defensible.
ISO 14644-1 defines cleanroom classification based on airborne particle concentration at specific size thresholds. The standard establishes nine classification levels, from ISO Class 1 (most stringent) through ISO Class 9 (least stringent). Each class specifies the maximum number of particles of a given size that can be present per cubic meter of air.
For pharmaceutical manufacturing, ISO Class 5 is typical for critical operations like aseptic filling (iso.org). For semiconductor fabrication, requirements often demand ISO Class 3 or better, depending on the process node. USP 797 and USP 800 for compounding pharmacies specify ISO Class 5 for critical operations and ISO Class 7 for supporting areas (usp.org). These aren’t arbitrary numbers, they’re tied to contamination risk and product safety.
The particle counting methodology itself is rigorous. Isokinetic sampling is the standard approach: the sampling probe must be oriented and positioned so that particles enter the probe at the same velocity as the surrounding air. If you sample too aggressively, you’ll capture more large particles than actually exist. If you sample too passively, you’ll miss them. This is why calibrated equipment and trained personnel matter.
Particle size thresholds are critical to understanding what you’re actually measuring. Most pharmaceutical cleanroom classifications focus on particles 0.5 micrometers and larger. Semiconductor processes often require detection down to 0.1 micrometers or smaller. The smaller the particle you’re counting, the more challenging the measurement and the higher the cost of the equipment required. Applied Physics offers handheld condensation particle counters capable of detecting particles as small as 0.01 micrometers for applications requiring sub-10nm precision.
Recovery time also appears in ISO 14644-1 qualification. After introducing a challenge aerosol into the cleanroom, you measure how quickly particle counts return to baseline. This demonstrates that your air handling system is functioning and that contamination is being effectively removed. If recovery time is slower than your design specification, you have a problem that requires investigation and correction.
The statistical approach matters. ISO 14644-1 requires multiple sampling locations and multiple samples at each location. You can’t validate a cleanroom with a single particle count at a single point. The standard expects a defensible sampling plan that covers the entire cleanroom volume and accounts for variation. This is where many smaller facilities struggle, they don’t have the resources or expertise to design a statistically sound validation protocol.
Tracer particles are the visible mechanism that makes airflow visualization possible. Without them, you’d have no way to see how air actually moves through your cleanroom. The particles themselves must be non-contaminating, non-toxic, and uniform in size so they accurately represent the behavior of airborne particles in your actual manufacturing environment.
The most common tracer materials are mineral oil-based fog and water-based fog. Mineral oil fog produces denser, more visible tracer clouds and is often preferred for smoke studies in larger spaces. Water-based fog is gentler on equipment and personnel and is frequently used in pharmaceutical settings where product contact is a concern. Applied Physics cleanroom foggers generate both types depending on your facility’s requirements and your contamination control strategy.
Particle size of the tracer material is crucial. If tracer particles are too large, they won’t behave like the actual airborne contaminants you’re trying to control. They’ll settle too quickly and won’t accurately represent particle transport. If they’re too small, they may remain suspended indefinitely, making it difficult to observe flow patterns. The ideal tracer particle size is typically in the 1-10 micrometer range for visible observation, which approximates the behavior of larger contaminating particles.
The generation method affects tracer quality. Mechanical foggers that heat and aerosolize mineral oil can produce inconsistent particle sizes and may leave residue. Ultrasonic foggers that use ultrasonic vibration to create a fine mist produce more uniform particle sizes and leave minimal residue. This is why ultrasonic technology has become the standard in regulated environments. Applied Physics ultrasonic cleanroom foggers ensure consistent, non-contaminating tracer generation across repeated studies.
Particle distribution during a smoke study reveals critical information. If tracer particles follow a tight, vertical path downward from the ceiling in an ISO Class 5 cleanroom, you have unidirectional airflow working as designed. If particles spiral, stall, or move horizontally when they should move vertically, you’ve identified a potential contamination risk. Documenting this behavior, on video, with timestamps and location markers, creates the evidence that regulators expect.
Recovery of tracer particles is equally important. Once you stop introducing tracer fog, how quickly does it clear from the cleanroom? If it lingers for hours, your air exchange rate is inadequate. If it clears within minutes, your HVAC system is performing. This measurement directly informs your understanding of how quickly actual contaminants would be removed from your manufacturing environment. improving airflow methods.
Choosing the right particle counting equipment depends on your specific application, required sensitivity, and budget constraints. A pharmaceutical compounding pharmacy has different needs than a semiconductor fabrication facility. An ISO Class 7 environment requires less sensitive equipment than an ISO Class 3 fab. Your selection must align with your contamination control strategy and regulatory requirements.
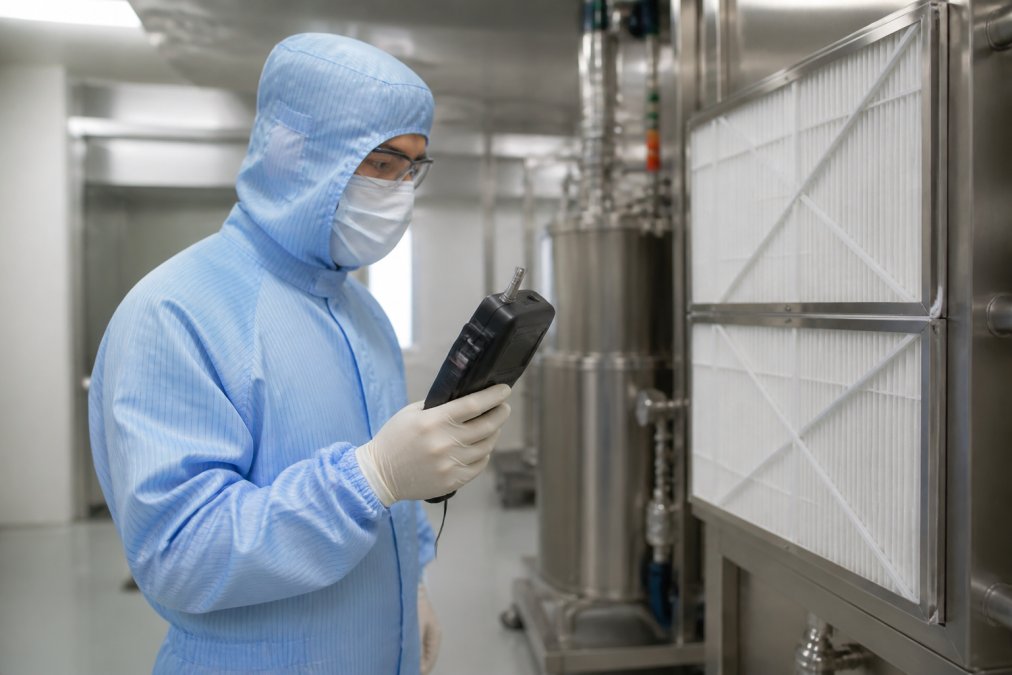
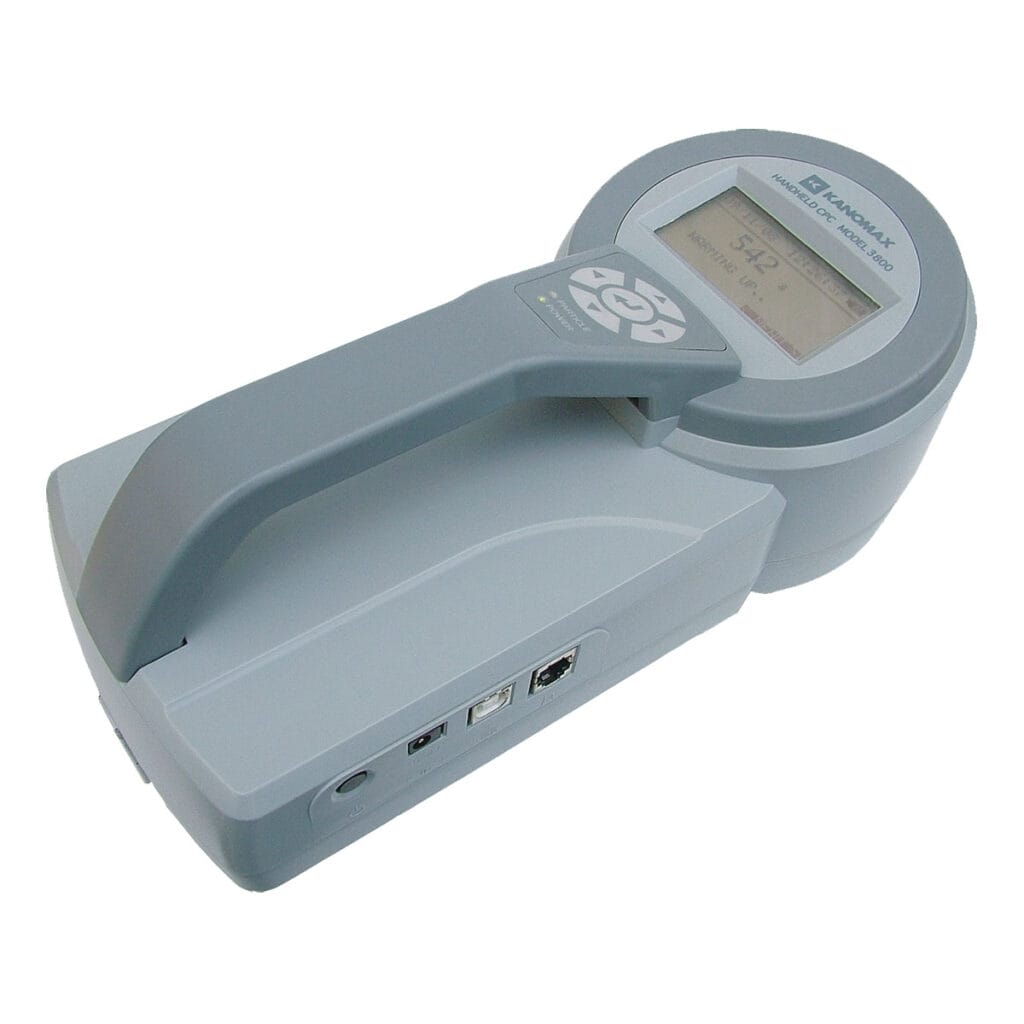
Handheld particle counters offer portability and flexibility. They’re ideal for validation studies, periodic monitoring, and troubleshooting specific areas of concern. Applied Physics offers the Handheld Condensation Particle Counter Model 3800, which detects particles as small as 0.01 micrometers with a measuring range up to 100,000 particles per cubic centimeter. For most pharmaceutical and biotech applications, this capability exceeds minimum requirements and provides margin for detecting emerging contamination issues.
Stationary monitoring systems provide continuous, real-time data. The Cleanroom Monitoring System Model CRMS from Applied Physics integrates particle counting, differential pressure monitoring, temperature, and humidity into a single platform. For facilities requiring continuous compliance documentation and rapid alert notification, stationary systems are essential. They create an automatic audit trail that satisfies regulatory expectations without requiring manual sampling.
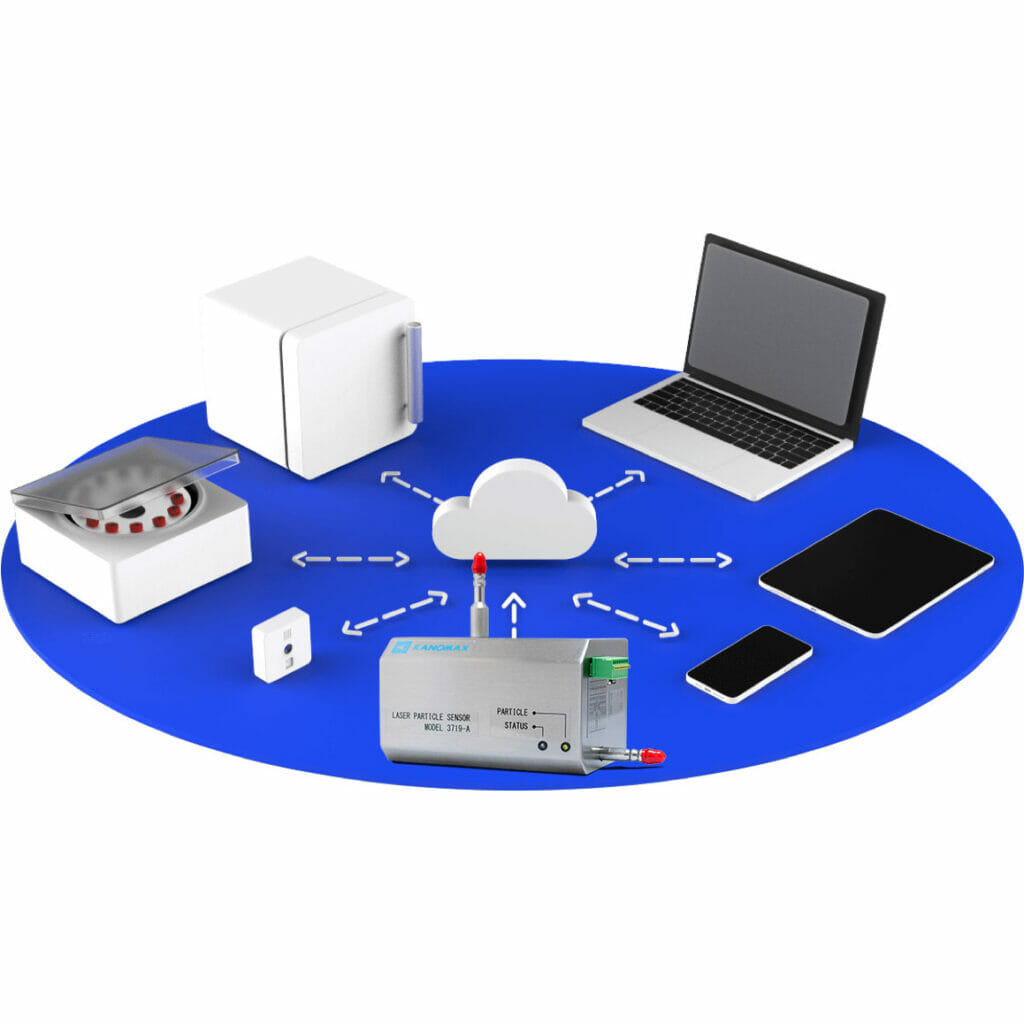
Microbial air sampling adds another dimension to air quality testing. While particle counts measure total particulates, microbial samplers specifically capture and culture airborne microorganisms. For sterile manufacturing under USP 797/800 and Annex 1, microbial monitoring is mandatory. Applied Physics offers the Microbial Air Sampler 3080 Series, which draws air at a stable 100 liters per minute and deposits microorganisms onto culture media for growth-based quantification.
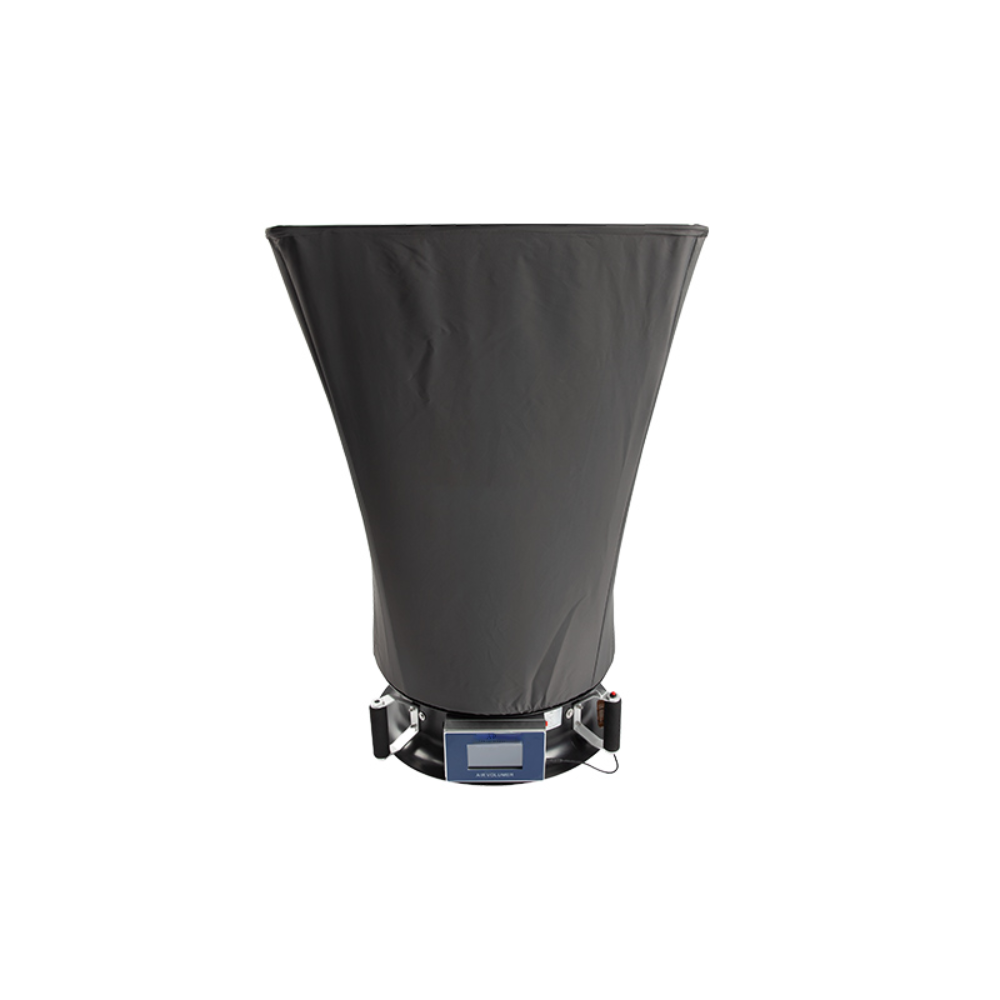
Air volume measurement is often overlooked but critical for understanding your cleanroom’s air exchange rate. Applied Physics Air Volume Meters (BK-AVM-1 and BK-AVM-1S) measure volumetric airflow rates essential for calculating recovery time and verifying that your HVAC system is delivering designed air changes per hour. Without accurate airflow measurement, you can’t validate that your cleanroom is performing as specified.
The decision framework is straightforward: start with your regulatory requirements and ISO classification target. Determine whether you need handheld portability or continuous monitoring. Identify the smallest particle size you must detect. Calculate your budget for equipment and calibration. Then select equipment that meets all requirements without unnecessary over-specification. Many facilities waste resources on equipment far more sensitive than their process requires.
Calibration and traceability matter as much as the equipment itself. Any particle counter you select must be calibrated to NIST standards and include documentation of that calibration. Applied Physics ensures all equipment is factory-calibrated and provides ongoing calibration support. Without traceable calibration, your particle count data has no regulatory credibility.
| Aspect | Airflow Visualization | Particle Counting |
|---|---|---|
| Measurement Type | Qualitative (visual observation) | Quantitative (numerical data) |
| What It Shows | Air movement patterns, flow direction, dead zones | Contamination levels, particle concentration |
| Equipment | Cleanroom fogger, camera | Particle counter, sampling probe |
| Time to Complete | 2-4 hours per study | 1-2 hours per sampling location |
| Regulatory Requirement | Annex 1, design validation | ISO 14644-1, ongoing compliance |
| Data Output | Video/photos with observations | Numerical counts per cubic centimeter |
| Frequency | Typically annual or after changes | Periodic or continuous monitoring |
| Cost | Lower equipment cost | Higher equipment and calibration cost |
| Best For | Design verification, troubleshooting | Compliance documentation, contamination control |
A comprehensive contamination control strategy requires both airflow visualization and particle counting working together. Neither method alone provides sufficient evidence that your cleanroom is performing safely and reliably. The integration of these data sources creates a complete picture of your contamination risk and demonstrates to regulators that you understand your process environment.
Start with the smoke study. This is your baseline understanding of how air actually moves through your facility. Document everything: air velocity, flow direction, stagnant zones, and recovery time. This visual evidence tells you whether your cleanroom design is working as intended. If the smoke study reveals problems, fix them before conducting particle counts. There’s no point validating a system that’s fundamentally broken.
Once airflow patterns are confirmed, conduct particle counting at the locations identified as highest risk during the smoke study. Focus your sampling at points where smoke studies showed air stagnation or recirculation. This targeted approach ensures you’re measuring contamination risk where it’s most likely to occur. Apply the Air Volume Meter to confirm air exchange rates align with your design specification.
Create a data integration protocol that combines visual observations from smoke studies with numerical data from particle counts. This protocol becomes part of your audit trail. For example: "Smoke study on [date] confirmed unidirectional downward airflow at [location]. Particle count on [date] at the same location measured [number] particles per cubic centimeter, confirming ISO Class [X] performance." This narrative integration demonstrates that you understand your contamination control strategy and can defend it during audits.
Establish a monitoring frequency that makes sense for your process. Critical operations in pharmaceutical manufacturing typically require annual revalidation with smoke studies and monthly or quarterly particle count monitoring. Semiconductor fabrication may require more frequent monitoring depending on process node and yield requirements. Your contamination control strategy should specify these frequencies and the rationale for them.
Use the Cleanroom Monitoring System Model CRMS to establish continuous baseline data. This system captures particle counts, differential pressure, temperature, and humidity automatically. When you conduct periodic smoke studies or handheld particle counts, you can compare your spot measurements against this continuous baseline. Deviations from baseline often signal problems that warrant investigation.
Document the relationship between your airflow patterns and your contamination control outcomes. If you observe poor airflow in a particular zone during smoke studies, expect particle counts to be elevated there. If particle counts are unexpectedly high despite good airflow, investigate whether you have a source of contamination you haven’t identified. This investigative approach transforms your validation data into actionable process intelligence.
Smoke studies sometimes reveal problems that seem puzzling until you understand the underlying cause. Spiral or chaotic airflow patterns in a downflow cleanroom often indicate that your ceiling plenum isn’t properly sealed or that return air paths are creating turbulence. The fix isn’t always obvious; you may need to adjust diffuser positions, seal gaps, or reconfigure return air ducting. Applied Physics can help diagnose these issues through systematic smoke study analysis.
Particle counts that exceed ISO limits despite good visual airflow suggest a contamination source you haven’t identified. Common culprits include unsealed penetrations, personnel shedding contamination through improper gowning, or equipment off-gassing. Conduct a detailed trace of where particles are coming from. Use the Handheld Condensation Particle Counter Model 3800 to sample directly upstream and downstream of suspected sources. This detective work often reveals simple fixes, better sealing, improved gowning procedures, or equipment relocation.
Recovery time failures, where tracer particles or elevated particle counts persist longer than design specification, usually indicate insufficient air exchange rate or inadequate filtration. Verify that your HEPA filters are actually performing. HEPA filter integrity testing using particle counters can confirm whether filters are clogged or bypassing contamination. If filters are intact, investigate whether your HVAC system is delivering designed airflow. Use the Air Volume Meter to measure actual airflow versus design specification.
Dead zones during smoke studies, where tracer particles stall and don’t move with the main airflow, are contamination risks that must be addressed. These often occur behind equipment, in corners, or at the junction of walls and ceilings. Solutions include repositioning equipment, installing additional return air ports, or increasing overall air exchange rate. Each solution has cost and operational implications; your contamination control strategy must weigh these trade-offs.
Inconsistent particle count results at the same location across different sampling events often indicate sampling methodology problems rather than actual contamination variation. Verify that your sampling probe is positioned correctly (isokinetic sampling), that you’re sampling for the correct duration, and that you’re not introducing contamination during the sampling process itself. Train personnel on proper sampling technique. Use calibrated equipment consistently.
Equipment drift, where particle counters begin reporting different values for the same air sample, signals that calibration is overdue. Particle counters require regular calibration to NIST standards. If your equipment hasn’t been calibrated within the manufacturer’s recommended interval, schedule calibration immediately. This is non-negotiable for regulatory compliance.
Tracer particle residue left in the cleanroom after smoke studies indicates that your fogger is introducing contamination rather than just visualization. Switch to non-contaminating fog sources. Applied Physics ultrasonic cleanroom foggers minimize residue through their generation method. If you’re using mechanical foggers that heat mineral oil, consider upgrading to ultrasonic technology.
Airflow visualization and particle counting are not competing methods, they’re complementary tools that together form a defensible contamination control strategy. Smoke studies show you how air moves; particle counts prove that movement is effective at controlling contamination. Regulators expect both, and facilities that integrate these methods pass audits while those that choose one or the other face repeat findings.
Applied Physics has spent over 30 years helping manufacturers navigate this complexity. Our cleanroom foggers, particle counters, and monitoring systems work together to give you complete visibility into your contamination control environment. The Handheld Condensation Particle Counter Model 3800 provides the sensitivity you need for critical operations. The Cleanroom Monitoring System Model CRMS creates continuous documentation that satisfies auditors. Together, they support the kind of rigorous process validation that protects your product and your facility’s compliance status. Contact Us to discuss how to integrate both methods into your validation protocol.
Airflow visualization tests use tracer particles or smoke to show directional airflow patterns, turbulent zones, and dead spots in a cleanroom. This qualitative method reveals whether unidirectional airflow is actually unidirectional and identifies contamination risks that particle counting alone cannot detect. Regulatory bodies often require smoke studies during initial qualification and requalification cycles to confirm airflow uniformity and pressure differential integrity.
Particle counting measures the airborne particle concentration at specific points using quantitative data (particles per cubic foot or cubic meter). Airflow visualization shows directional flow patterns qualitatively. Particle counting validates that filtration and air exchange rates meet ISO 14644-1 standards, while smoke studies confirm that airflow patterns actually protect critical areas. Together, they provide a complete contamination control strategy: visualization reveals flow geometry; particle counting proves filtration performance.
Airflow visualization studies are required under Annex 1 guidelines for initial cleanroom qualification and whenever facility changes occur (layout modifications, equipment installation, HEPA filter replacement). USP 797 and USP 800 standards for sterile compounding pharmacies mandate smoke studies to verify unidirectional airflow in ISO Class 5 and Class 7 areas. GMP regulations require documented airflow validation as part of the contamination control strategy. Most facilities repeat smoke studies annually or during requalification cycles.
No. Particle counting and airflow visualization serve different purposes and cannot fully replace each other. Particle counting validates that filtration meets ISO classification requirements, but it does not show airflow direction, velocity, or dead zones where contaminants can accumulate. Smoke studies reveal flow patterns that particle counts miss. Regulatory audits expect both methods as part of a comprehensive contamination control strategy. Using only one method leaves blind spots in your validation documentation.
Airflow visualization requires a cleanroom fogger (such as a handheld LN2 or ultrasonic fogger), tracer particles, and sometimes a remote control for adjustable fog volume. Particle counting requires a condensation particle counter or optical particle counter capable of detecting particles down to 0.01 micrometers, with data logging and compliance reporting features. The Handheld Condensation Particle Counter Model 3800 detects particles as small as 0.01 micrometers with a measuring range up to 100,000 particles per cubic centimeter. For integrated monitoring, the Cleanroom Monitoring System Model CRMS provides continuous particle tracking and regulatory compliance documentation.
This article was written using GrandRanker

Enter your details below to save your shopping cart for later. And, who knows, maybe we will even send you a sweet discount code :)
Allow notifications to get real-time updates about your shopping cart and who knows, you may even receive a sweet discount code 😊