
Last updated: October 18, 2026. Technical references: EU GMP Annex 1, including section 4.32 on requalification; FDA aseptic-processing guidance; and ISO 14644-1 scope. Apply the current requirements relevant to the facility and process.
Cleanroom downtime can create substantial production, quality and recovery costs. Calculate the impact for the actual facility; the earlier $125,000-per-hour claim was not established as a cleanroom-specific benchmark.
Treat qualification and maintenance as lifecycle activities. Proactive planning can reduce avoidable disruption, but savings depend on the process and demonstrated performance.
Assess a shutdown through the quality system to determine required investigations, testing and requalification before restart. Not every event requires repeating all IQ/OQ/PQ activities, and no universal two-to-three-week recovery period applies.
Include lost production, affected product, investigation, testing and restart costs in the estimate. Previously quoted daily and hourly cost ranges lacked a documented basis for the reader’s facility and should not be used as forecasts.
Planning and maintainable design may reduce downtime. The earlier claim of up to 60% reduction was not substantiated here; establish targets and verify results using site data.
Predictive maintenance uses condition and performance data to help identify developing equipment problems. Detection lead time depends on the failure mode, instrumentation and data quality; it is not guaranteed.
Condition and performance data can help prioritize maintenance. No universal 30–50% reduction from AI or reliability-centered maintenance is established by this article.
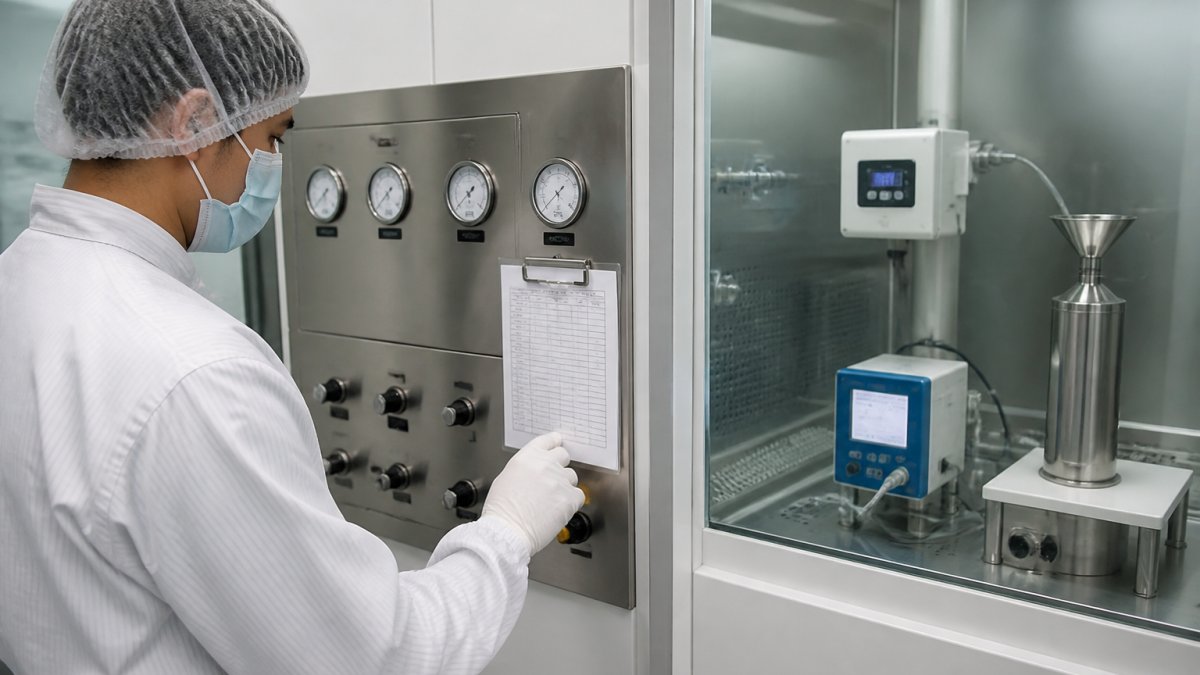
Cleanroom technician monitoring real-time data on a control panel display, with particle counters and sensor equipment visible in the background
Here’s how to implement this:
A previously stated 40% improvement at an unnamed pharmaceutical manufacturer was not supported by a traceable study. Evaluate benefits against documented baseline and follow-up data.
HVAC performance affects environmental control and maintenance planning. Changes should remain within qualified operating limits and follow change control.
Set and qualify airflow velocity for the actual process, room design and applicable sector requirements. A study-specific 0.30–0.33 m/s range is not a universal cleanroom acceptance band or an ISO-class requirement.
Optimize your HVAC system using these steps:
Room-side access can simplify filter maintenance. The required shutdown, testing and requalification scope depends on the installation and the impact assessment, not simply the direction from which the filter is replaced.
Room-side replacement does not waive change control, containment assessment, post-installation testing or applicable requalification. Protect affected operations and obtain required approval before return to service.
The mechanics are simple but powerful:
The earlier 35% reduction attributed to an unnamed biotech facility was not substantiated. Assess maintenance benefits using documented site-specific evidence.
Airflow visualization can help investigate airflow patterns and support qualification. Its effect on project duration depends on the facility and protocol.
There are three primary visualization approaches, each with distinct advantages for validation acceleration:
Smoke Testing (Qualitative Airflow Visualization)
Smoke testing uses visible tracer particles to show airflow patterns in real time. Technicians release smoke at key points and observe movement, revealing dead zones or backflow that particle counters might miss.
Airflow visualization supports assessment of airflow patterns; ISO 14644-3 addresses test methods, while ISO 14644-1 addresses particle classification. The previously stated two-week saving at an unnamed facility was not verified.
Smoke or fog studies require an approved method, suitable tracer, and controls to protect products and processes. Schedule studies in appropriate operating states; avoid introducing uncontrolled contamination into active production.
Particle Tracer Dispersion Modeling
Tracer selection should consider visibility, buoyancy, particle size, persistence and compatibility with the process. No tracer can be assumed to represent every contaminant or leave no residue without evaluation.
Tracer studies may inform understanding of transport and recovery. They do not automatically justify reducing PQ monitoring, and the earlier 30–40% reduction claim was not substantiated.
Use an approved tracer-study protocol with justified sampling locations, duration and acceptance criteria. Generic five-to-ten-point and 30–60-minute instructions are not substitutes for a qualified method.
Computational Fluid Dynamics (CFD) Simulation and Digital Twin Validation
CFD modeling creates a virtual 3D model and simulates airflow, particle transport, and contamination before physical validation. This allows you to test scenarios and predict failure modes without touching the real facility.
A computational model can help evaluate design options, but uncertainty and assumptions must be checked against the installed system. It cannot guarantee a successful physical qualification.
Simulation can inform planning, but reduced testing must be justified and preserve applicable qualification, monitoring and release requirements. A digital model does not prove installed performance.
No traceable evidence was established here for a universal 25–35% validation-time reduction. Treat any projected saving as a site-specific estimate requiring verification.
Integrating Visualization into Your Validation Protocol
Select and sequence the methods appropriate to the facility and approved protocol:
Earlier planning can help resolve problems before formal execution. Compare actual planning and execution costs rather than relying on unsupported generic downtime figures.
Documentation and Compliance
Document test methods, conditions, acceptance criteria, results, deviations and approvals. Images or video can support the record but do not replace the required measurements or evaluation.
Risk-based qualification focuses effort on functions important to product quality and safety. It does not authorize a reduction in mandatory requirements, and the earlier 30–45% downtime claim was not substantiated.
Base qualification scope on applicable quality-risk-management and validation requirements. ICH Q14 concerns analytical procedure development; it is not authority for the cleanroom tiering rules proposed here.
Classifying Cleanroom Parameters by Risk
The tiers below are an illustrative planning framework, not regulatory categories or permission to omit required tests. Assign criticality from the actual process, product risks and applicable requirements.
Tier 1: Higher-Criticality Parameters
Tier 1 illustrates functions that are critical to the process. Failure impact and the scope of investigation or requalification must be assessed for the affected facility.
For Tier 1 parameters:
Tier 2: Supporting Functions Requiring Assessment
Tier 2 illustrates supporting functions only where a documented assessment supports that classification. Doors, gowning areas, surfaces and other listed systems can directly affect contamination control and may be critical.
For Tier 2 parameters:
Tier 3: Lower-Criticality Functions Where Justified
Tier 3 applies only where a documented assessment establishes lower criticality. Records, monitoring instruments and identification systems can be critical; do not exempt them solely because they appear on this list.
For Tier 3 parameters:
Implementing Risk-Based IQ/OQ/PQ Protocols
Once you’ve classified parameters, design your validation protocols accordingly:
Installation Qualification (IQ) – Risk-Based Approach
Operational Qualification (OQ) – Risk-Based Approach
Performance Qualification (PQ) – Risk-Based Approach
Illustrative Planning Example
The following is a hypothetical planning example, not a verified pharmaceutical-facility case study. Actual durations, criticality assignments and release decisions require a site-specific approved protocol.
Any reduction from a proposed 16-week plan to a 10-week plan is an illustration, not a measured result or expected saving. Required qualification and acceptance criteria still apply.
Calculate financial effects using documented production hours, recoverable output, contribution margin and actual project costs. No verified dollar saving is established by this hypothetical example.
Regulatory Acceptance and Audit Readiness
Risk-based planning can focus resources, but compliance depends on meeting the applicable requirements and approved qualification criteria, not on adopting a tier label.
Key documentation for audit readiness:
Phased Validation Across Quarters
Phased work is appropriate only where the released scope remains qualified and unaffected operations are demonstrably protected. Complete required qualification before using a new or changed system.
The schedule below is illustrative project sequencing, not a universal qualification timetable or permission to defer required testing.
Neither 90% uptime nor compliance is guaranteed by phased scheduling. Evaluate the plan against the facility, process risks and required qualification activities.
Understanding the cleanroom validation timeline lets you plan maintenance and avoid surprise downtime. Validation isn’t instant. It requires planning, execution, and documentation.
The timeline below is an illustrative planning aid, not a normative duration. Set scope and timing from the facility, applicable requirements, resources and approved protocol.
| Phase | Duration | What Happens |
|---|---|---|
| Planning & Protocol Development | 2-4 weeks | Define acceptance criteria, prepare documentation |
| Installation Qualification (IQ) | 1-2 weeks | Verify equipment installation and connections |
| Operational Qualification (OQ) | 2-4 weeks | Test equipment performance under normal conditions |
| Performance Qualification (PQ) | 2-6 weeks | Validate cleanroom performance with product present |
| Documentation & Audit | 1-2 weeks | Compile records, prepare for regulatory review |
| Total Timeline | 8-18 weeks | Depends on complexity and risk level |
Advance planning can help coordinate qualification and maintenance. Evaluate actual disruption and costs rather than assuming a fixed reduction.
ISO 14644-1 addresses cleanroom classification by airborne particle concentration. It does not by itself cover the full pharmaceutical validation lifecycle or all microbiological and process requirements.
The checklist below combines classification, maintenance and quality-system considerations. Apply the relevant standards and sector requirements rather than treating every item as an ISO 14644-1 mandate.
An approved, documented plan can help prepare for review, but cannot guarantee that an audit will find no deficiencies.
Evaluate investments against site-specific risks, operational constraints and documented costs. Potential benefits require evidence rather than a universal savings assumption.
Modular cleanroom construction offers these advantages:
A digital twin can help simulate proposed changes before implementation. Its predictions depend on model quality and validation against the real facility; physical qualification and acceptance testing remain necessary.
A universal 25–35% reduction in validation duration has not been substantiated here. Measure any benefit against a defined baseline and comparable project scope.
Return on investment depends on implementation costs, model maintenance and verified operating benefits. An 18–24 month payback should not be assumed.
Reducing downtime requires sound maintenance, qualified systems, appropriate monitoring and well-planned qualification. These tools can support the work, but do not replace required testing or guarantee compliance.
Applied Physics offers airflow visualization and particle measurement equipment. Contact Applied Physics to discuss equipment suitability for your approved methods and facility requirements.
Downtime costs vary by site, process and accounting method. Estimate lost contribution, recovery costs and project costs from facility records. The previously quoted hourly costs and percentage savings are not established cleanroom benchmarks.
Delays can arise from equipment failures, unsuitable methods, documentation gaps, deviations and resource constraints. Room-side filter replacement may simplify access, but does not eliminate contamination risk or required post-change testing.
Airflow visualization shows airflow patterns and can support troubleshooting and qualification. It does not directly measure particle concentration or establish a universal air velocity. Use appropriate instruments and facility-specific acceptance criteria.
ISO 14644-1 defines classification by airborne particle concentration. Plan its tests alongside other applicable qualification and regulatory requirements. A checklist alone cannot guarantee certification or prevent requalification.
APPLIED PHYSICS TECHNICAL RESOURCE
Airflow visualization, smoke studies, tracer delivery, particle monitoring and controlled-environment validation. Product and standards references should be interpreted for the actual instrument, facility, protocol and configuration.

Enter your details below to save your shopping cart for later. And, who knows, maybe we will even send you a sweet discount code :)
Allow notifications to get real-time updates about your shopping cart and who knows, you may even receive a sweet discount code 😊