Last Updated: August 17, 2026
A particle size analyzer is an instrument that measures the distribution and size of particles suspended in liquids or dispersed in gases, ranging from nanometers to hundreds of micrometers. For semiconductor fabrication, pharmaceutical manufacturing, and cleanroom operations, this measurement capability is non-negotiable, contamination control depends on knowing exactly what particles exist in your process environment.
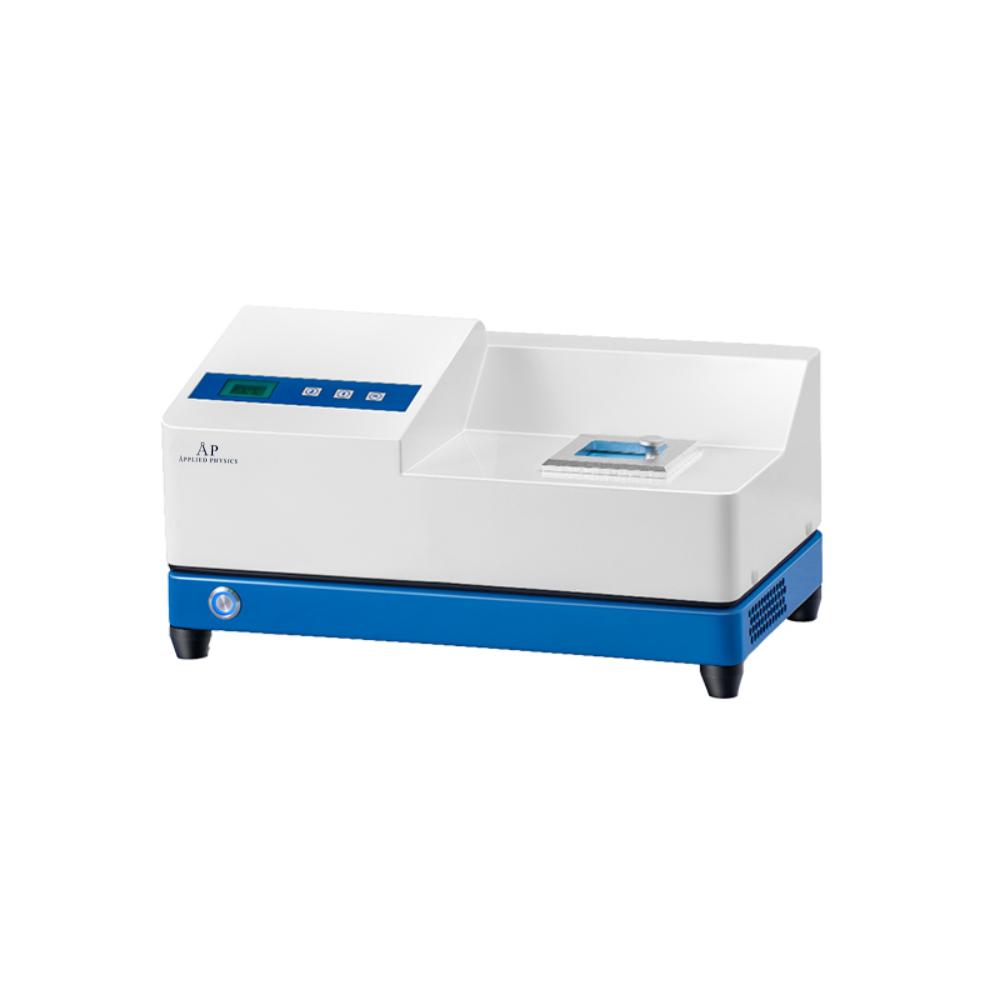
The stakes are real. A single 10-nanometer particle can render a semiconductor wafer unusable at advanced nodes. In sterile compounding pharmacies operating under USP 797 standards, undetected particulate matter in injectable preparations creates regulatory liability and patient safety risk. In biotech research facilities maintaining ISO-certified cleanroom environments, particle metrology validates that your airflow patterns actually work as designed.
Most organizations think particle size analysis is a specialized lab function. What they’re missing is that a particle size analyzer directly impacts yield, compliance audits, and production downtime. Applied Physics has spent over three decades helping manufacturers across semiconductor, cleanroom, and pharmaceutical sectors deploy metrology solutions that catch problems before they become costly recalls or failed inspections.
Below, we’ll walk you through the core technologies, laser diffraction and dynamic light scattering, show you how to choose the right measurement range for your application, explain the regulatory requirements you actually need to meet, and break down the total cost of ownership so you can make a vendor decision based on real economics, not just feature lists.
Laser diffraction remains the workhorse of particle size distribution measurement across manufacturing environments. The technology is mature, well-understood by regulators, and delivers reproducible results across a wide measurement range, typically from 0.1 micrometers to several millimeters depending on the instrument configuration.
Laser diffraction particle size analysis operates on a straightforward physical principle: when a laser beam passes through a suspension of particles, those particles scatter light at angles that correlate directly to their size. Smaller particles scatter light at wider angles; larger particles scatter at narrower angles. A detector array positioned at multiple angles captures this scattering pattern, and optical theory, specifically Fraunhofer diffraction and Mie theory calculations, converts that pattern into a particle size distribution.
The instrument illuminates a sample with a coherent laser beam (typically helium-neon or solid-state laser at 632 or 405 nanometers). Particles in the beam scatter this light. A multi-element detector array, positioned at angles from near-forward to wide-angle scattering, records the intensity at each angle. Proprietary algorithms apply Fraunhofer or Mie theory depending on the particle size range and optical properties, then calculate the volume-weighted mean diameter and the full distribution curve.
What matters in practice: laser diffraction gives you a fast, repeatable measurement of the overall distribution. You get a single result in seconds to minutes, not hours. The trade-off is that laser diffraction reports volume-weighted data, it’s biased toward larger particles because they scatter more light. If your process contains a small fraction of very large contamination particles mixed with many smaller ones, laser diffraction will flag the large particles prominently. That’s usually what you want for contamination control, but it’s worth understanding the bias.
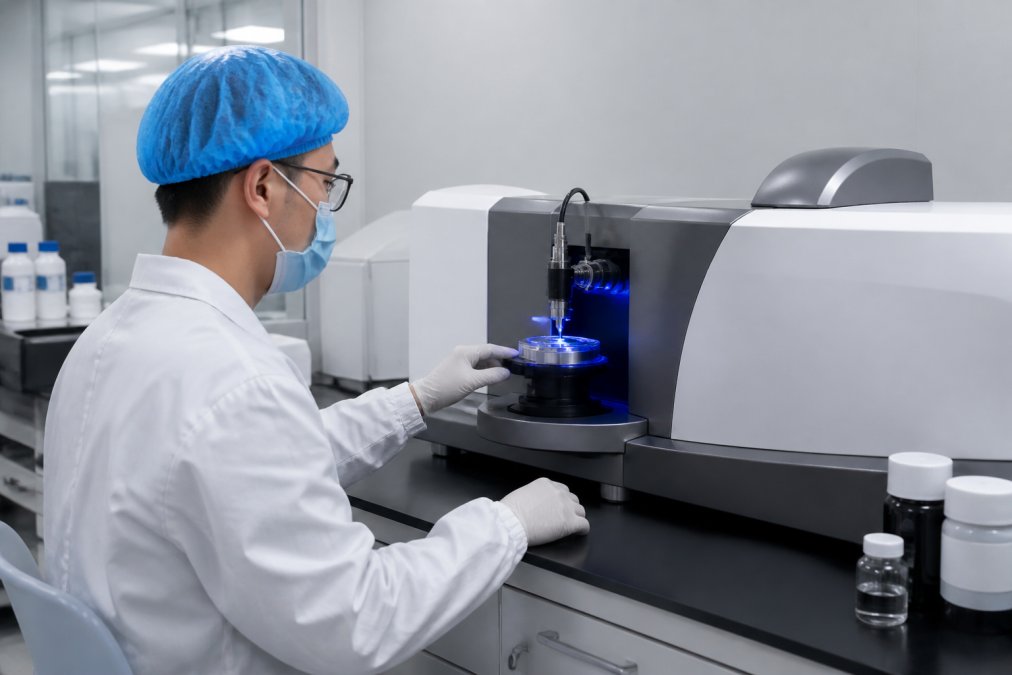
The choice between wet and dry sample preparation fundamentally changes what you’re measuring and how you interpret results.
Wet sample analysis suspends particles in a liquid carrier, typically water, ethanol, or an application-specific solvent. The suspension flows through a measurement cell where the laser beam interrogates it. Wet analysis is the standard for pharmaceuticals, coatings, inks, and colloids because it preserves particle interactions and mimics real-world suspension behavior. You’re measuring particles as they exist in the product environment.
The downside: wet analysis requires careful sample preparation. Particle agglomeration, clumping caused by electrostatic or van der Waals forces, can artificially inflate measured particle sizes. Ultrasonic dispersion helps break agglomerates, but over-sonication can damage fragile particles. For pharmaceutical suspensions under USP 797, your validation protocol must document the exact sonication parameters you use, because changing them changes your results.
Dry powder analysis uses a dry powder feeder to aerosolize particles into a measurement chamber, typically with compressed air or nitrogen. This method is essential for powders, pigments, and materials that are unstable or insoluble in liquid carriers. Dry analysis measures particles in their native state without solvent interactions.
The trade-off: dry powder feeders require careful calibration. Feeding rate, air pressure, and vibration frequency all affect how particles are dispersed into the measurement beam. Inconsistent feeding produces irreproducible results. For semiconductor metrology, dry analysis is often preferred because it eliminates solvent effects and measures particles as they’d be encountered in a cleanroom environment.
Applied Physics supports both wet and dry configurations in their nanoparticle size analyzer systems. The choice depends on whether your validation protocol specifies measurement in suspension or as dispersed powder, regulatory guidance often dictates this.
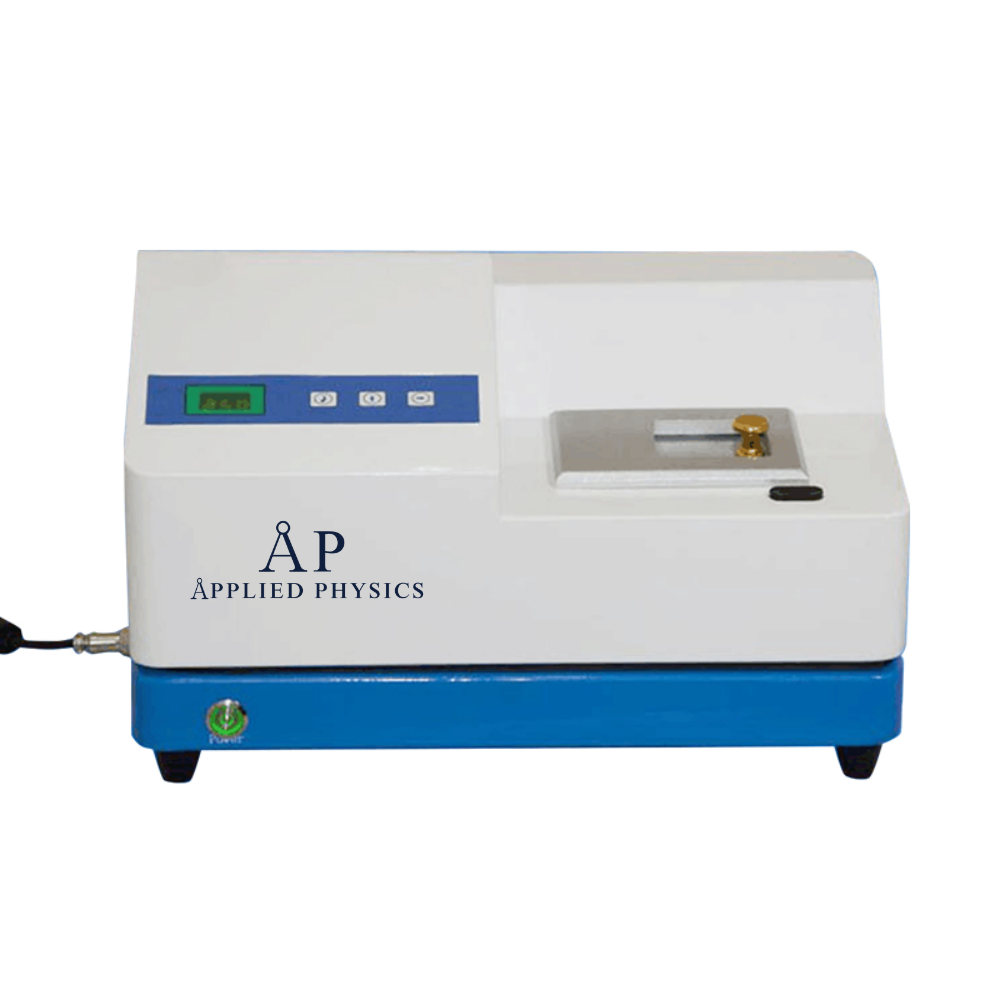
Measurement is only meaningful if your instrument is calibrated against traceable standards. Calibration validates that your particle size analyzer actually reports accurate diameters, not just relative comparisons.
Standards for particle size analysis come in two forms: polystyrene latex spheres (PSL) for optical calibration and certified reference materials (CRM) for validation. PSL standards are monodisperse, all particles are essentially the same size, and come with NIST traceability in sizes from 50 nanometers to 100 micrometers. A 10-micrometer PSL standard, for example, has a certified diameter and a stated uncertainty band.
When you measure a PSL standard with your particle size analyzer, the reported mean diameter should fall within the certified range. If it doesn’t, your instrument is out of calibration. The frequency of recalibration depends on your regulatory environment, pharmaceutical GMP typically requires quarterly or semi-annual validation; semiconductor metrology often requires monthly or continuous monitoring.
Here’s where many organizations stumble: they calibrate once during installation and assume the instrument stays calibrated. Laser alignment drifts. Detector sensitivity changes with temperature and humidity. Optical windows accumulate dust or residue. Without periodic recalibration against fresh standards, your measurement data gradually becomes unreliable, and you won’t know it until an audit or failed product batch forces a recount.
Applied Physics provides calibration wafer standards and reference materials specifically designed for semiconductor and pharmaceutical validation workflows. These standards come with documented traceability and support the sub-10nm precision required for advanced semiconductor nodes.
Semiconductor fabrication at 5nm nodes and below operates at a scale where particle contamination is measured in single-digit nanometers. A 10nm particle on a wafer surface can cause yield loss. Below 10nm, particles become individual atomic-scale defects that affect transistor performance.
Laser diffraction alone cannot reliably measure particles below approximately 100 nanometers because the scattering signal becomes too weak and dominated by optical noise. For sub-10nm detection, semiconductor fabs rely on dynamic light scattering (DLS) or specialized electron microscopy techniques.
Dynamic light scattering measures Brownian motion, the random thermal movement of nanoparticles suspended in liquid. Smaller particles move faster; larger particles move slower. By analyzing the time-dependent fluctuations in scattered light intensity, DLS calculates a diffusion coefficient and converts it to a particle diameter using the Stokes-Einstein equation. DLS can measure particles from 1 nanometer to roughly 1 micrometer, with highest precision in the 5-100 nanometer range.
The advantage for semiconductor metrology: DLS detects nanoparticles that laser diffraction misses entirely. If your process generates colloidal particles or metallic nanoparticles from equipment wear, DLS will catch them.
The limitation: DLS requires particles to be in liquid suspension and assumes spherical particle morphology. It reports a number-weighted distribution, it counts particles, not volume, so it’s biased toward smaller particles. A suspension with 99% tiny nanoparticles and 1% large contamination particles will show the nanoparticles dominating the distribution, even if the large particles are the real yield risk.
Applied Physics offers customized nanoparticle size analyzer systems that combine laser diffraction for larger particles with DLS for sub-100nm characterization, giving fab engineers visibility across the full contamination spectrum.
Semiconductor fabs validate their metrology systems using calibration wafer standards, reference wafers with particles of known size and composition deposited at defined locations. A calibration wafer might have 50-nanometer gold particles, 100-nanometer silica particles, and 1-micrometer latex particles distributed across the surface in a known pattern.
When you run your particle size analyzer against the calibration wafer, the instrument should detect particles at the expected sizes and locations. Deviation from the standard indicates instrument drift, optical misalignment, or detector degradation.
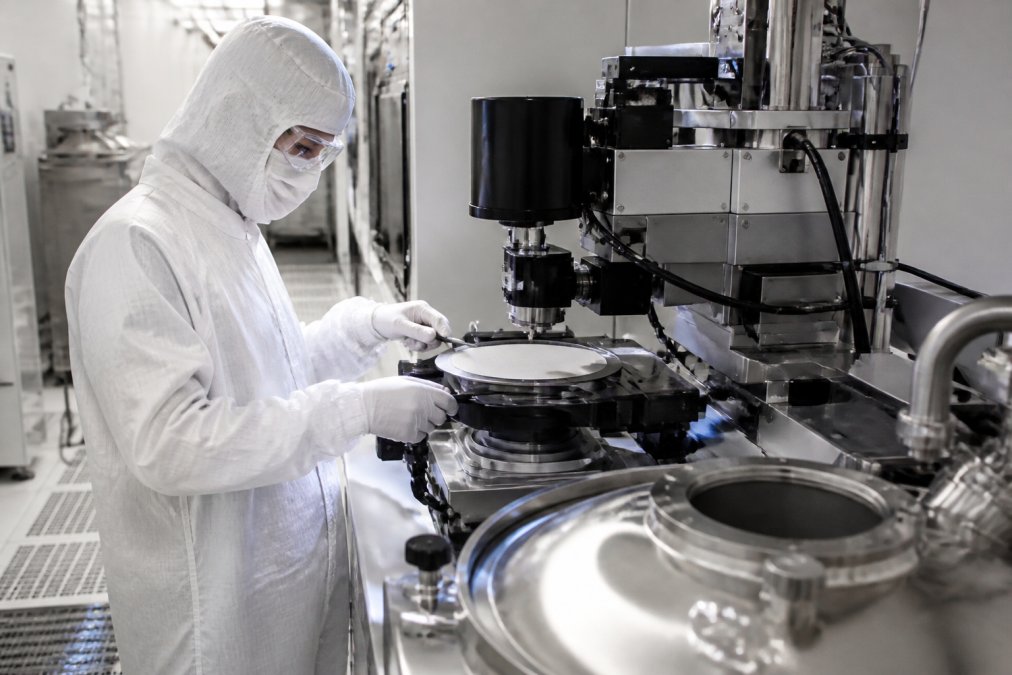
The challenge: calibration wafers are expensive, typically $2,000-$5,000 each, and they degrade with use. Repeated measurements, storage in humidity-controlled conditions, and dust exposure all affect wafer integrity. Fabs typically use calibration wafers quarterly or semi-annually, not continuously, because the cost and handling burden become prohibitive otherwise.
Applied Physics’ calibration wafer standards are engineered for repeatability across measurement cycles and include comprehensive documentation of particle composition, size distribution, and spatial layout. For fabs moving to 5nm and 3nm nodes, the precision of your calibration standard directly affects your confidence in yield data.
The choice between dynamic light scattering and laser diffraction is not "pick one", it’s "use both for full visibility."
Laser diffraction excels at high-throughput measurement of particles from 100 nanometers to several micrometers. It’s fast, strong, and well-established in regulatory frameworks. A laser diffraction particle size analyzer can process a sample in 30-60 seconds and deliver a full distribution curve.
Dynamic light scattering provides precision in the sub-100nm range where laser diffraction becomes unreliable. DLS measurements take longer, typically 1-5 minutes per sample, because the instrument must collect enough fluctuation data to calculate accurate diffusion coefficients. DLS is also more sensitive to sample preparation; aggregation, dust contamination, or improper dilution can corrupt results.
In practice, leading semiconductor fabs and pharmaceutical manufacturers run both methods on critical samples. Laser diffraction gives you the bulk distribution and flags large contamination. DLS confirms that your sub-micron population is actually what you think it is. If DLS detects unexpected nanoparticles that laser diffraction didn’t report, that’s a process signal worth investigating.
Applied Physics’ customized nanoparticle size analyzer integrates both technologies in a single platform, allowing operators to run complementary measurements on the same sample without transferring between instruments.
A particle size analyzer’s measurement range defines the minimum and maximum particle diameters it can reliably detect. Typical ranges:
Sensitivity, the ability to detect small changes in particle size or to identify rare large particles in a predominantly small-particle population, depends on detector resolution, optical alignment, and data acquisition parameters. A poorly aligned laser diffraction instrument might have a measurement range of 0.1-3,000 micrometers on paper but practically only resolve particles reliably between 0.5-2,000 micrometers.
Data interpretation requires understanding what your particle size analyzer actually reports. Most instruments default to volume-weighted distributions, the median diameter (D50) represents the particle size at which 50% of the sample volume is smaller and 50% is larger. This is useful for contamination control because large particles dominate the volume, but it obscures the count of smaller particles.
If you need to know how many nanoparticles are present, relevant for colloidal stability or aggregation monitoring, you need a number-weighted distribution from dynamic light scattering. If you’re tracking yield loss from large contamination particles, volume-weighted laser diffraction is your metric.
The polydispersity index (PDI) measures how tightly distributed particle sizes are around the mean. A PDI of 0.1 indicates a narrow, monodisperse population; a PDI of 0.5 or higher indicates a broad, polydisperse population. For pharmaceutical suspensions, a high PDI might indicate aggregation or degradation. For semiconductor process monitoring, a sudden shift in PDI can signal equipment wear or process drift.
Regulatory frameworks dictate how you must validate your particle size analyzer and what measurement standards you must meet.
USP 797 (Pharmaceutical Compounding) requires that sterile compounded preparations be free of visible particulates and meet defined limits for sub-visible particles. Particle size analysis is the primary method for validating these limits. Your particle size analyzer must be calibrated against traceable standards, and your measurement protocol must be documented and validated. The USP recognizes laser diffraction as the standard method for particles from 2 micrometers upward.
USP 800 (Hazardous Compounding) extends these requirements to hazardous drugs, with additional contamination control requirements for cytotoxic preparations. Particle size analysis is part of the environmental monitoring protocol.
FDA guidance on particulate matter in injectables (21 CFR 788.1) requires that injectable products meet particulate limits. Manufacturers must validate their analytical methods, including particle size analyzers, using the FDA’s recommended protocols. This typically means demonstrating that your instrument can accurately measure reference standards and that your measurement reproducibility meets statistical criteria.
ISO 14644 (Cleanroom Classification) specifies particle count limits by size category for different cleanroom classes. ISO 14644-1 defines Class 1 through Class 9 based on airborne particle concentration. Cleanroom validation requires particle counting and size analysis to confirm that the facility meets its classified level. Particle size analyzers used for ISO 14644 validation must be calibrated and operated according to ISO 14644-2 (Monitoring and control).
Semiconductor industry standards (SEMI F1, SEMI M1) define particle size measurement requirements for wafer processing environments and calibration standards. SEMI F1 specifies the characteristics of polystyrene latex particle size standards used in semiconductor metrology. SEMI M1 defines monitoring protocols for particle contamination in fab environments.
Compliance is not a one-time checkbox. Regulatory audits increasingly focus on the validation history of your analytical instruments. Auditors will ask: When was your particle size analyzer last calibrated? What standards did you use? Do you have documented evidence of measurement reproducibility? If your calibration records are incomplete or your measurement protocol isn’t documented, you’ll face observations or findings.
Applied Physics supports regulatory compliance by providing calibration standards with full traceability documentation and consulting on validation protocols specific to pharmaceutical GMP, semiconductor SEMI standards, and cleanroom ISO 14644 requirements.
Even well-maintained particle size analyzers produce incorrect results when sample preparation or instrument setup goes wrong. Here are the most common errors and how to diagnose them.
Agglomeration in wet samples. Particles clump together, inflating the measured mean diameter. You measure 5-micrometer agglomerates when the actual primary particles are 1 micrometer. Diagnosis: run a duplicate sample with increased ultrasonic dispersion time. If the second measurement shows a smaller mean diameter, agglomeration was the culprit. Fix: standardize sonication parameters and validate that your sonication time is sufficient but not excessive (over-sonication damages fragile particles).
Optical misalignment. The laser beam is not centered in the measurement cell, or the detector array is not properly aligned with the scattering angles. Result: systematically biased measurements, often appearing as a shift toward larger or smaller diameters. Diagnosis: run a certified reference standard (e.g., 10-micrometer PSL). If the result is outside the certified range, suspect alignment drift. Fix: perform the instrument’s alignment procedure per manufacturer documentation, typically using an alignment jig and laser power meter.
Contamination in the measurement cell. Dust, residual sample material, or optical film buildup on cell windows scatters stray light, reducing signal-to-noise ratio and corrupting the measurement. Diagnosis: baseline signal quality degrades over time; measurement noise increases. Fix: clean the measurement cell according to the manufacturer’s protocol, typically flushing with solvent and air-drying, not wiping (which can scratch optical surfaces).
Incorrect sample dilution. Sample concentration is too high, causing multiple scattering where particles scatter light off each other rather than off the laser beam directly. Measured size distribution becomes artificially broad or biased. Diagnosis: re-measure the same sample at a lower concentration. If the result shifts toward smaller diameters and narrower distribution, over-concentration was the issue. Fix: follow the manufacturer’s recommended concentration range, typically verified by checking that the laser transmission through the sample is within a specified window (e.g., 50-90% transmission).
Temperature drift. Particle size analyzers are sensitive to temperature because refractive index changes with temperature, and thermal expansion affects optical alignment. Diagnosis: measure the same standard at the beginning and end of a measurement session; if results drift, temperature variation is likely. Fix: allow the instrument to warm up for 30 minutes before taking measurements; run samples in a temperature-controlled room (±2°C).
Incorrect optical parameters for your sample. You’ve entered the wrong refractive index for your particles, or the Mie/Fraunhofer selection is incorrect for your size range. The algorithm calculates the wrong size distribution. Diagnosis: compare your results to an independent method (e.g., electron microscopy). If they disagree, suspect optical parameters. Fix: verify particle composition and refractive index; consult the instrument manual for guidance on Mie vs. Fraunhofer selection based on your size range.
The purchase price of a particle size analyzer is typically 30-40% of the true cost of ownership over five years. The remaining 60-70% comes from calibration standards, maintenance, training, and downtime.
A laser diffraction particle size analyzer might cost $25,000-$60,000 depending on optical configuration and automation. A combined laser diffraction and dynamic light scattering system runs $40,000-$100,000. Over five years, add:
Total five-year cost: $65,000-$190,000 depending on instrument class and operational intensity.
Vendor selection should prioritize:
Calibration standard availability and cost. Can the vendor supply the specific standards you need (e.g., sub-10nm gold particles for semiconductor metrology)? Are replacement standards reasonably priced, or are you locked into an expensive proprietary supply chain?
Maintenance and support responsiveness. Does the vendor have local service technicians, or is repair a weeks-long mail-in process? For GMP-regulated labs, extended downtime is unacceptable.
Regulatory documentation. Does the vendor provide calibration certificates with full traceability? Can they support your validation protocol with documented procedures and reference materials?
Software and data integration. Can the instrument export data in formats your LIMS (Laboratory Information Management System) accepts? Is the software intuitive enough that your team can operate it without constant vendor support calls?
Applied Physics’ automatic laser nanoparticle size analyzer and customized systems come with comprehensive calibration documentation, local technical support, and integration guidance for semiconductor fabs and pharmaceutical labs. For organizations moving from legacy equipment or switching vendors mid-cycle, Applied Physics’ team works through the validation transition to minimize downtime and ensure regulatory continuity.
Choosing the right particle size analyzer requires matching instrument capability to your specific measurement challenge, whether that’s sub-10nm nanoparticle detection for semiconductor advanced nodes, sub-visible particulate validation for USP 797 compliance, or cleanroom airflow verification for ISO 14644 certification. The technology is mature, but implementation complexity remains high. Applied Physics has supported this transition for over three decades, providing not just instruments but calibration standards, validation protocols, and technical guidance that reduce your time-to-compliance and operational risk. Contact Applied Physics to discuss your specific metrology requirements and explore how their precision contamination control solutions align with your facility’s regulatory and performance goals.
A particle size analyzer measures the distribution and concentration of particles in samples to ensure product quality and process control. In pharmaceutical manufacturing, it validates USP 797 and USP 800 compliance by detecting contamination in sterile preparations. In semiconductor fabrication, it monitors yield-critical contamination at advanced nodes (5nm and below) and validates cleanroom environments. Quality assurance teams use particle size analyzers to detect defects before they reach customers, reducing costly recalls and regulatory violations.
These percentile values describe the particle size distribution. The d10 is the diameter below which 10% of particles fall; d50 (median) is where 50% fall below and 50% above; d90 is the diameter below which 90% of particles fall. Together, they define the spread and central tendency of your sample. A narrow distribution (small gap between d10 and d90) indicates consistent product quality, while a wide spread suggests process variability or contamination that needs investigation.
Laser diffraction excels at measuring larger particles (0.5-500 micrometers) with high throughput and repeatability, making it ideal for quality control in manufacturing. Dynamic light scattering measures smaller particles (1-1000 nanometers) with greater precision but slower analysis and smaller sample volumes. For semiconductor contamination control requiring sub-10nm detection, dynamic light scattering provides superior sensitivity. For bulk pharmaceutical powders and suspension stability, laser diffraction offers faster results and better statistics. Your choice depends on your particle size range and production speed requirements.
FDA regulations require pharmaceutical manufacturers to validate all analytical instruments under 21 CFR Part 11 and follow USP 797 (sterile compounding) and USP 800 (hazardous drugs) standards for contamination monitoring. ISO 14644 governs cleanroom classification and particle counting requirements. Semiconductor facilities must meet SEMI standards for wafer cleanliness and metrology accuracy. Before purchasing or switching vendors, confirm that your analyzer meets these standards and that your regulatory team has approved the validation protocol to avoid re-qualification delays.
Common errors include improper sample preparation (inadequate dispersion, air bubbles, or contamination), incorrect refractive index settings for your material, optical bench misalignment, and detector saturation from overconcentrated samples. Prevent these by using ultrasonic dispersion for consistent suspension, validating your instrument with calibration standards before each run, maintaining a clean optical path, and diluting samples to the manufacturer's recommended concentration range. Regular instrument maintenance and operator training reduce repeatability errors by 30-50% and catch calibration drift before it affects production decisions.
This article was written using GrandRanker

Enter your details below to save your shopping cart for later. And, who knows, maybe we will even send you a sweet discount code :)
Allow notifications to get real-time updates about your shopping cart and who knows, you may even receive a sweet discount code 😊