Last Updated: July 23, 2026
Maintaining sterile manufacturing environments requires precision, and gmp compliant airflow testing methods form the backbone of pharmaceutical and semiconductor cleanroom operations. At Applied Physics, we’ve spent decades helping facilities validate their critical environments, and the difference between passing inspection and facing costly remediation often comes down to how thoroughly teams approach airflow qualification. Below, we’ll show you exactly how to implement testing protocols that satisfy regulatory expectations while catching real contamination risks before they impact product quality.
The stakes are high. A single undetected airflow failure can compromise entire batches, trigger regulatory action, or worse, allow microbial contamination into aseptic processes. Yet many facilities treat airflow validation as a checkbox exercise rather than a strategic control point. This guide covers the methods that separate compliant operations from those that merely look compliant on paper.
GMP compliant airflow testing methods are standardized procedures for validating that cleanroom environments maintain the velocity, direction, and particle containment characteristics required by regulatory standards. These methods measure whether air moves at the correct speed (typically 0.3-0.5 meters per second for Grade A environments), follows the intended laminar or unidirectional pattern, and effectively removes contaminants.
The core purpose is simple: prove that your HVAC system delivers what it claims to deliver. In practice, this involves smoke visualization, velocity measurement, filter integrity testing, and microbial recovery studies. Each method answers a different question about your environment’s performance.
Many facilities confuse compliance with testing. Compliance means meeting cGMP and EU GMP Annex 1 requirements. Testing is how you demonstrate compliance. The distinction matters because a test that doesn’t align with regulatory expectations won’t protect you during an FDA or EMA inspection.
Regulatory requirements define what "compliant" actually means, and they’ve become stricter over the past decade. The EU GMP Annex 1 guidance, updated in 2022 and fully implemented by 2023, sets the global standard for aseptic manufacturing. In the United States, cGMP regulations (21 CFR Part 11 and Part 211) establish similar expectations, though with less prescriptive detail about specific testing methods.
Both frameworks require that Grade A environments (where aseptic operations occur) maintain unidirectional airflow at a velocity of 0.3-0.5 m/s. This isn’t arbitrary. The velocity range prevents turbulence that could carry particles into the product zone while ensuring adequate air change rates to remove contaminants.
EU GMP Annex 1 explicitly requires:
The cGMP framework requires similar controls but leaves the specific methods to manufacturers. This flexibility is both a strength (you can choose the most appropriate testing approach) and a risk (regulators expect you to justify your choices).
According to FDA guidance on aseptic processing, facilities must establish and maintain written procedures documenting all environmental monitoring and qualification activities. This means your testing isn’t complete until you’ve created a validation master plan, executed the tests, documented results, and established ongoing monitoring protocols.
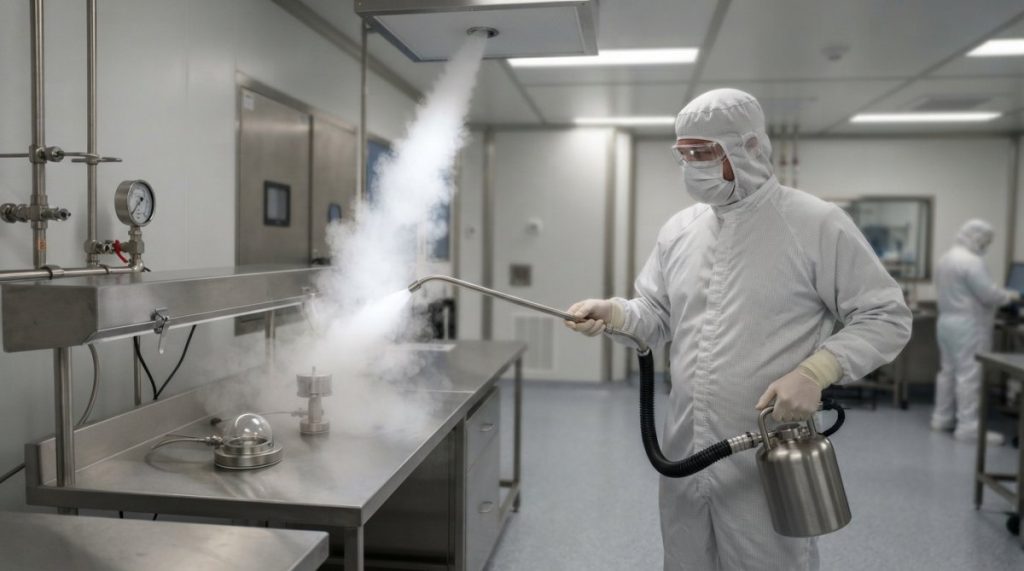
Airflow visualization studies answer the most fundamental question: does air actually move the way the HVAC design says it should? These studies use smoke or fog to make airflow patterns visible, revealing dead zones, turbulence, and directional failures that instruments alone might miss.
Unidirectional airflow means air flows in one direction, typically from ceiling-mounted HEPA filters downward to floor-level exhaust grilles. This pattern is critical in Grade A environments because it sweeps particles and microorganisms away from the product zone.
Laminar flow is the ideal state: parallel simplifies with minimal turbulence. In practice, perfect laminar flow is rare. Small disturbances from equipment, personnel, and thermal gradients create local turbulence. The goal is to keep turbulence within acceptable limits, typically less than 20% of the mean velocity.
Applied Physics cleanroom foggers, including both LN2 ultrapure and ultrasonic models, generate neutral particles that visualize these patterns without introducing contaminants. The choice between ultrasonic and LN2 generation matters more than many operators realize. Ultrasonic foggers produce water-based aerosols that can bias your particle counts if not properly controlled. LN2 systems generate alcohol-based fog that evaporates completely, leaving no residue.
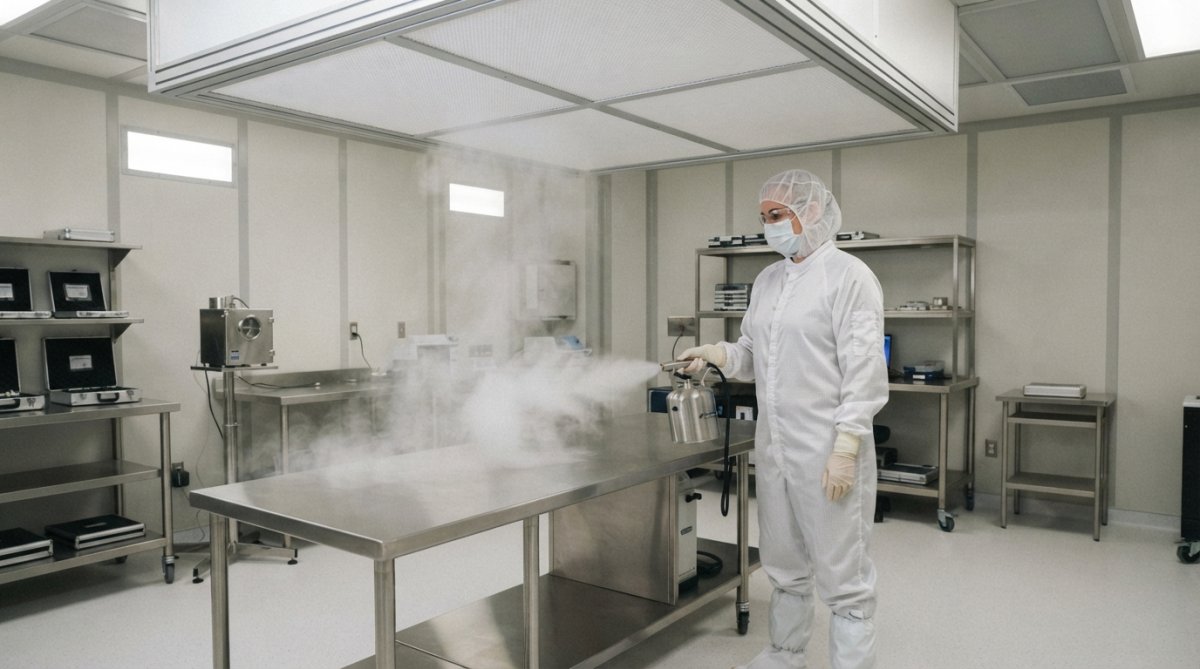
A proper smoke study requires careful planning. You’ll need:
The actual procedure is straightforward. Release smoke at various points in the Grade A zone, near the edges, in corners, at different heights, and observe how it moves. Smoke should flow smoothly toward exhaust grilles without swirling back toward the product zone.
Common failure modes include smoke rising toward the ceiling (indicating upward airflow or turbulence), pooling in corners (dead zones), or moving horizontally before descending (turbulence or incorrect HVAC balance). Each failure points to a specific problem: filter placement, obstruction, or HVAC balancing issues.
Document everything. Photograph or video the smoke patterns. Note the date, time, environmental conditions, and personnel present. This documentation becomes part of your qualification file and demonstrates due diligence during inspections.
ISO 14644-3 is the international standard for cleanroom testing methods. It defines precise procedures for measuring velocity distribution and calculating air change rates, the two most critical airflow parameters.
Velocity distribution testing uses a hot-wire anemometer or thermal anemometer to measure air speed at multiple points across the Grade A zone. ISO 14644-3 specifies a grid pattern: typically 9 measurement points arranged in a 3×3 matrix across the work surface.
At each point, you measure velocity in three dimensions (X, Y, Z axes) to capture directional information. The mean velocity should fall within the target range (0.3-0.5 m/s for Grade A). More importantly, the standard deviation of velocities across all points should be less than 20% of the mean. This requirement ensures that no area is significantly slower or faster than others, which would indicate uneven air distribution or local turbulence.
Turbulence intensity is calculated as the standard deviation divided by the mean velocity. High turbulence (above 20%) indicates that local air currents are creating swirling patterns rather than smooth laminar flow. This matters because turbulent zones can trap particles and allow them to settle onto product or equipment.
The testing procedure is time-intensive but straightforward:
Many facilities rush this step. They take one reading per point and call it done. That approach misses transient variations that indicate intermittent turbulence. Professional practice involves at least five readings per point over a 30-second period.
Air change rate (ACR) is the number of times the total volume of air in the room is replaced per hour. For Grade A environments, the target is typically 20 air changes per hour or higher, though the specific requirement depends on the equipment configuration and process design.
ACR is calculated as: ACR = (Total volumetric airflow rate) / (Room volume)
For example, if your Grade A zone is 100 cubic meters and your HVAC system supplies 400 cubic meters per hour, your ACR is 4 changes per hour.
The relationship between ACR and particle removal is direct: higher ACR means faster particle clearance. However, higher ACR also means higher energy consumption and cost. The regulatory requirement is that your design justifies your chosen ACR through risk assessment and aseptic process simulation.
Recovery time testing validates that your ACR is adequate. You deliberately introduce a contamination challenge (typically a measured aerosol concentration), then measure how long it takes for the environment to return to acceptable particle counts. If recovery time exceeds your specification, your ACR is insufficient.
HEPA filters are the last line of defense against particle contamination. Filter integrity testing (also called aerosol photometer testing or AFPT) proves that your filters have no leaks and are properly seated.
The AFPT procedure introduces a known concentration of test aerosol (typically dioctylphthalate or DOP) upstream of the filter and measures the concentration downstream. A compliant filter shows less than 0.01% penetration, meaning 99.99% of particles are captured.
Applied Physics Aerosol Photometer BAP-350 and Aerosol Generator-Cold Type BAG-6D provide the precision needed for this testing. The photometer measures particle concentration with high sensitivity, while the aerosol generator produces a consistent, controllable challenge.
The procedure involves:
Filters should be tested initially after installation, after any system modification, and periodically during operation (typically annually). A filter showing greater than 0.01% penetration must be replaced immediately.
Pressure differential is the invisible control that keeps contaminants out. Grade A zones are typically maintained at positive pressure relative to surrounding areas, usually 10-15 pascals higher than adjacent Grade B spaces.
This pressure differential creates an airflow barrier. If a door opens or a seal fails, air flows outward, carrying any particles in the Grade A zone away from the product. Without this pressure barrier, air (and contaminants) can flow inward.
Pressure monitoring is typically continuous. Differential pressure gauges or electronic transducers measure the pressure difference between Grade A and adjacent spaces. Most facilities set alarms to alert operators if pressure drops below acceptable limits.
The challenge with pressure monitoring is that it’s indirect. A stable pressure differential suggests that your HVAC system is functioning, but it doesn’t prove that airflow velocity or direction is correct. This is why pressure monitoring must be paired with periodic velocity distribution testing, not as a replacement for it.
Cleanroom qualification isn’t a one-time event. It’s a structured program that begins with risk assessment, moves through initial qualification, and continues with ongoing monitoring.
The IQ/OQ/PQ approach (Installation Qualification, Operational Qualification, Performance Qualification) provides the structure that regulators expect.
Installation Qualification (IQ) confirms that the HVAC system was installed according to design specifications. This includes documenting equipment serial numbers, verifying that filters are the correct type and size, confirming that ductwork is sealed properly, and checking that pressure sensors are calibrated. IQ is primarily documentation and visual inspection, you’re not yet running the system at full capacity.
Operational Qualification (OQ) tests the system under normal operating conditions. This is where you conduct velocity distribution testing, filter integrity testing, and smoke studies. OQ answers: does the system perform as designed when running?
Performance Qualification (PQ) validates that the system maintains environmental control during actual aseptic processing. This includes aseptic process simulation (running the manufacturing process with growth medium instead of product to detect any microbial contamination), environmental monitoring during production runs, and recovery time testing after intentional contamination challenges.
All three phases must be documented in a validation master plan before you begin. The plan should specify acceptance criteria for each test, the rationale for those criteria, and the actions you’ll take if results fail to meet criteria.
In-situ testing means testing under actual operating conditions, with equipment running, personnel present, and the process executing normally. Static testing occurs with the system idle.
Regulators increasingly expect in-situ testing because it reflects real conditions. A cleanroom that passes static testing but fails in-situ testing isn’t actually controlled during manufacturing.
The challenge is that in-situ testing is more variable. Personnel movement, equipment operation, and thermal loads all affect airflow. This variability is precisely why it matters, you need to know that your environment remains controlled even when people are working in it.
A strong qualification program includes both. Static testing (typically during initial qualification) establishes the baseline. In-situ testing (during OQ and ongoing) confirms that the system performs under real conditions.
Airflow testing proves that your environment has the physical characteristics needed to prevent contamination. Contamination monitoring proves that it actually works.
Aseptic process simulation (APS) is the most critical validation step for aseptic manufacturing. You run your entire manufacturing process exactly as you would with product, except you use growth medium instead of drug substance. Any microorganisms present in the environment will grow in the medium, making contamination visible.
APS typically involves three runs of the process. All three must show zero growth to demonstrate that your environment is adequately controlled. A single positive result triggers investigation, corrective action, and repeat testing.
Recovery time testing complements APS. You deliberately introduce a contamination challenge (an aerosol or liquid inoculum) into the Grade A zone and measure how quickly particle counts return to acceptable levels. Recovery time must meet your specification, typically 5-15 minutes depending on the air change rate and environmental design.
Both tests validate that your airflow velocity, direction, and air change rate are adequate to prevent microbial contamination during actual manufacturing.
Applied Physics Microbial Air Sampler BK-BAS2 and Biological Air Sampler enable precise microbial monitoring. These instruments collect air samples onto growth media, allowing you to quantify microbial contamination and identify the organisms present.
Your testing results are only defensible if your instruments are calibrated and validated. During FDA or EMA inspections, regulators will request calibration certificates, acceptance criteria, and evidence that instruments were within calibration windows when testing occurred. Missing or expired calibrations are a common observation, and they can invalidate your entire qualification file.
Thermal Anemometers (Hot-Wire and Vane)
Thermal anemometers measure velocity distribution and must be calibrated against a primary standard. The standard for anemometer calibration is NIST-traceable wind tunnel calibration or comparison against a calibrated reference anemometer.
Calibration interval: Annually for instruments used in GMP environments. If an anemometer is used more than 50 times per year, consider semi-annual calibration. After any drop, impact, or visible damage, recalibrate before use.
Acceptance criteria: Readings must be within ±3% of the reference standard across the operating range (typically 0.1-2.0 m/s for cleanroom work). If an instrument reads outside this tolerance, it must be repaired or replaced.
Why this matters: An anemometer reading 0.35 m/s when the true velocity is 0.34 m/s (3% error) is acceptable. An anemometer reading 0.35 m/s when true velocity is 0.30 m/s (14% error) will cause you to pass a test that should fail. This error compounds across your entire velocity distribution study, potentially masking turbulence or inadequate air change rates.
Aerosol Photometers (AFPT Equipment)
Photometers measure particle concentration and are used for filter integrity testing. Calibration involves comparing the photometer’s response to known aerosol concentrations using a calibrated aerosol generator and reference photometer.
Calibration interval: Semi-annually for instruments in regular use. Photometers are sensitive to optical drift and contamination, requiring more frequent calibration than velocity instruments.
Acceptance criteria: Photometer readings must be within ±10% of the reference standard across the measurement range (typically 0.1-100 µg/L for cleanroom testing). Zero-check and span-check must be performed before each use and documented.
Why this matters: Filter integrity testing relies on measuring penetration at the 0.01% level. A photometer with 10% error at low concentrations can miss a filter leak that allows 0.02% penetration (which would fail the test). The regulatory consequence is significant: a leaking filter that passes your test could allow unfiltered air into your Grade A zone.
Pressure Transducers and Differential Pressure Gauges
Pressure instruments monitor the isolation barrier between Grade A and adjacent areas. Calibration compares the instrument’s reading against a primary pressure standard (typically a water column manometer or calibrated pressure pump).
Calibration interval: Annually for electronic transducers; Every 2 years for mechanical gauges if they’re not in continuous service. Transducers used for continuous monitoring should be calibrated annually.
Acceptance criteria: Readings must be within ±2% of full scale or ±0.5 Pa, whichever is greater. For a 0-50 Pa range transducer, this means ±1 Pa accuracy.
Why this matters: Pressure monitoring is your first warning system for HVAC failure. If your transducer reads 12 Pa when true pressure is 8 Pa, you won’t receive an alarm when the system actually fails. Conversely, a transducer reading 8 Pa when true pressure is 12 Pa will trigger false alarms, eroding operator confidence in the system.
Aerosol Generators (DOP/DEHS Challenge Sources)
Aerosol generators produce the test challenge for filter integrity testing. Calibration confirms that the generator produces the specified aerosol concentration and particle size distribution.
Calibration interval: Annually, or after any maintenance or repair. If you change the aerosol type (e.g., from DOP to DEHS), recalibrate before use.
Acceptance criteria: Output concentration must be within ±10% of the setpoint. Particle size distribution must match the specification (typically 0.3-0.5 µm median diameter for AFPT).
Why this matters: If your aerosol generator is producing 90 µg/L when you think it’s producing 100 µg/L, your filter penetration calculation will be off by 10%. This error is small enough to hide but large enough to affect your pass/fail decision on marginal filters.
Calibration confirms that an instrument reads correctly at a specific point in time. Validation confirms that it performs correctly under the conditions where you’ll use it.
Environmental Validation: An anemometer calibrated at 20°C may read differently at 25°C (typical cleanroom temperature). Validate that your instruments perform within specification across the temperature and humidity ranges you’ll encounter. Document this validation in your qualification file.
Functional Validation: Before each testing campaign, perform a functional check. For anemometers, verify that zero-velocity readings are correct and that the instrument responds to air movement. For photometers, perform a zero-check and span-check using calibrated aerosol standards. Document these checks in your test protocol.
Measurement System Analysis (MSA): For critical measurements like velocity distribution, conduct an MSA to quantify the uncertainty contributed by your instrument. Repeatability (multiple readings at the same point) and reproducibility (different operators, different times) should be documented. If your measurement uncertainty is more than 10% of your acceptance criterion, you may need to improve your measurement system or widen your acceptance criteria.
Maintain a calibration log for each instrument, including:
Store calibration certificates in a centralized location (physical or digital) that’s easily retrievable during inspections. Many facilities use a calibration management system that sends alerts when instruments approach expiration.
Choose a calibration laboratory that:
Many facilities maintain a small inventory of backup instruments so that calibration doesn’t delay testing. This approach is cost-effective if you conduct testing frequently.
Calibration costs vary by instrument type and laboratory:
For a typical facility conducting annual airflow qualification, budget $1,500-$3,000 annually for calibration services. This cost is small relative to the cost of a failed batch or regulatory action, making it a strategic investment in compliance.
Paper records are increasingly difficult to defend during regulatory inspections. Digital documentation systems provide traceability, audit trails, and version control that paper cannot.
A compliant digital system should:
Many facilities still use spreadsheets for data management. Spreadsheets lack audit trails, version control, and signature capability. They’re acceptable for preliminary data collection, but final qualification records should be in a validated system.
The investment in a compliant documentation system pays dividends. During inspections, you can quickly retrieve complete records with full traceability. You can demonstrate trending, showing that your environment remains stable over time. You can correlate airflow parameters with contamination events.
Not every test passes on the first attempt. The difference between a facility that recovers quickly and one that faces extended downtime is a systematic approach to diagnosing failures. This section provides decision trees and diagnostic procedures for the most common airflow test failures.
A velocity distribution test fails when either mean velocity falls below 0.3 m/s or standard deviation exceeds 20% of mean velocity. These are distinct problems with different root causes.
Diagnostic Workflow for Low Mean Velocity
If your mean velocity is below 0.3 m/s, the HVAC system is not delivering adequate airflow to the Grade A zone. Follow this sequence:
Check filter pressure differential. Locate the pressure gauge on your HVAC system’s supply-side filter bank. If pressure differential exceeds the filter manufacturer’s maximum (typically 0.5-1.0 inches of water column), filters are loaded and restricting airflow. Replace filters and retest. This is the most common cause of low velocity.
Verify HVAC system operation. Confirm that the supply fan is running at full speed. Check the VFD (variable frequency drive) setpoint if your system uses one. A VFD set to 80% speed will deliver 80% of design airflow. If the setpoint is below 100%, increase it and retest.
Inspect ductwork for leakage. Low velocity can indicate that air is escaping through unsealed ducts rather than reaching the Grade A zone. Conduct a visual inspection of all accessible ductwork, particularly at joints and around penetrations. Use a smoke stick to identify leakage points. Seal leaks with appropriate ductwork sealant (mastic or metal tape, depending on duct type) and retest.
Check for obstructions in the supply plenum. Equipment, shelving, or structural elements in the plenum above the Grade A zone can block airflow. If obstructions are present, relocate them if possible. If relocation isn’t feasible, modify the HVAC system to route air around the obstruction.
Verify damper settings. If your HVAC system has balancing dampers, confirm that dampers in the Grade A zone supply are fully open. Partially closed dampers reduce airflow to that zone. Adjust dampers and retest.
Measure total airflow at the HVAC unit. If mean velocity remains low after the above steps, the problem may be at the source. Measure airflow at the HVAC supply outlet using a calibrated anemometer or flow hood. Compare measured airflow to the design specification. If measured airflow is significantly below design, the HVAC system may be undersized or the fan may be failing. This requires HVAC service and potentially system upgrade.
Diagnostic Workflow for High Turbulence (Standard Deviation > 20% of Mean)
High turbulence indicates that airflow is uneven across the Grade A zone. Some areas move faster than others, creating swirling patterns. This is more complex to diagnose because multiple factors can contribute.
Conduct a smoke study. Before diving into measurements, visualize the airflow pattern using smoke. Smoke that swirls, rises toward the ceiling, or pools in corners indicates turbulence. Note the location of turbulent areas, this narrows your diagnosis. Turbulence near the edges suggests filter coverage issues. Turbulence in the center suggests obstruction or thermal effects.
Check filter coverage. HEPA filter banks should extend across the entire work surface. If filter coverage is incomplete, unfiltered air from uncovered areas mixes with filtered air, creating a turbulent boundary layer. Measure the extent of filter coverage and compare to the Grade A zone boundary. If coverage is incomplete, extend the filter bank or relocate equipment to areas with complete coverage.
Identify obstructions in the airflow path. Equipment, shelving, or structural elements downstream of the filters create wakes of turbulent air. Use your smoke study to identify the obstruction. If the obstruction is movable, relocate it. If it’s fixed (e.g., a structural column), modify the HVAC system to route air around it or accept the turbulence in that localized area and adjust your Grade A zone boundary accordingly.
Assess thermal stratification. Temperature differences create density layers in air, causing vertical mixing. This is particularly common in tall cleanrooms or those with significant heat-generating equipment. Measure air temperature at multiple heights in the Grade A zone. If temperature varies by more than 2°C between top and bottom, thermal stratification is likely. Solutions include improving HVAC temperature control (tighter setpoint), adding supplemental cooling to hot equipment, or modifying the air distribution pattern to promote mixing.
Check for personnel or equipment in the airflow path. During your velocity distribution test, ensure that personnel are positioned away from the measurement grid and that no equipment is blocking airflow. Even a person standing in the airflow path creates a wake. If turbulence is high during occupied testing but low during unoccupied testing, personnel positioning is the issue. Establish clear protocols for where personnel can stand during testing.
Rebalance the HVAC system. If turbulence is localized to one area, the HVAC balancing dampers may be misaligned. Engage a qualified HVAC technician to rebalance the system. This involves adjusting dampers to equalize pressure and velocity across all zones. Rebalancing is an iterative process and may require multiple test cycles.
A filter integrity test fails when downstream aerosol concentration exceeds 0.01% of upstream concentration. This indicates a leak in the filter media or seal.
Diagnostic Workflow
Confirm the photometer is functioning correctly. Before concluding that the filter is leaking, verify that your photometer is calibrated and functioning. Perform a zero-check (measure background aerosol with no challenge source) and a span-check (measure a known aerosol concentration). If zero or span checks are out of specification, recalibrate the photometer and repeat the filter test.
Identify the location of the leak. If the photometer confirms high penetration, the next step is locating the leak. Conduct a visual inspection of the filter frame and seals. Look for gaps, cracks, or separation between the filter media and frame. Common leak locations are the corners of the filter frame and around the gasket seal.
Check filter installation. Confirm that the filter is installed correctly and fully seated in its frame. A filter that’s not fully seated will allow air to bypass the media. Remove the filter and reinstall it, ensuring that it’s fully seated and the frame is secured tightly.
Inspect the filter frame for damage. If the frame is bent, cracked, or corroded, it cannot seal properly. A damaged frame must be replaced along with the filter.
Test adjacent filters. If one filter shows high penetration, test the filters adjacent to it. If multiple filters are leaking, the problem may be system-wide (e.g., incorrect installation procedure, frame damage, or seal degradation). If only one filter is leaking, it’s a localized defect.
Replace the filter and retest. If the filter is confirmed to be leaking, replace it with a new filter of the same type and size. Reinstall and conduct the filter integrity test again. The replacement filter should show <0.01% penetration.
Investigate the root cause. If a filter fails shortly after installation, investigate why. Possible causes include improper handling during installation, defective filter media (rare but possible), or incompatible frame design. Document the failure and communicate with your filter supplier if defects are suspected.
Grade A zones are typically maintained at positive pressure (10-15 Pa above adjacent Grade B areas). If pressure drops below specification, the isolation barrier is compromised.
Diagnostic Workflow
Verify the pressure transducer is functioning. Check the transducer’s zero and span calibration. A miscalibrated transducer may be reading low when actual pressure is acceptable. If calibration is suspect, recalibrate the transducer before investigating further.
Check for obvious leaks. Walk around the Grade A zone perimeter and listen for air leakage. A significant leak will be audible. Common leak locations are door seals, pass-through openings, and cable/pipe penetrations. If you identify a leak, seal it and recheck pressure.
Verify HVAC supply and exhaust balance. Pressure is maintained by supplying more air than you exhaust. If supply and exhaust are balanced (equal airflow), pressure will be zero. Check your HVAC system’s supply and exhaust fan speeds. The supply fan should be running slightly faster than the exhaust fan (typically 5-10% higher). If they’re balanced, increase the supply fan speed and recheck pressure.
Inspect door seals and gaskets. Worn or damaged seals allow air to escape. Visually inspect all door seals in the Grade A zone. If seals are compressed, cracked, or missing, they must be replaced. This is a common maintenance issue in older cleanrooms.
Check for open doors or pass-throughs. An open door or unsealed pass-through will prevent pressure from building. Ensure all doors are closed and all pass-throughs are sealed during the pressure test.
Measure pressure at multiple locations. Pressure may vary across the Grade A zone if the space is large or has multiple entry points. Measure pressure at several locations (near doors, near exhaust grilles, in the center). If pressure is low near a specific door or area, that’s where the leak is located.
Recovery time is the time required for particle counts to return to baseline after a contamination challenge. If recovery time exceeds your specification, the air change rate is insufficient.
Diagnostic Workflow
Confirm the particle counter is functioning correctly. Particle counters can drift or become contaminated, giving false readings. Perform a zero-check (measure background particle count in a clean area) and a span-check (measure a known particle concentration). If the counter is out of specification, recalibrate and repeat the recovery time test.
Verify the contamination challenge was adequate. Recovery time is only meaningful if you introduced a sufficient contamination challenge. If the challenge was too small, recovery time will be artificially short. Confirm that you introduced the specified challenge concentration and that the challenge was distributed evenly across the Grade A zone.
Check for ongoing contamination sources. If particle counts don’t return to baseline, there may be an ongoing source of contamination (e.g., personnel shedding, equipment off-gassing, or external air leakage). Identify and eliminate the source. Repeat the recovery time test.
Verify HVAC system operation during the test. The HVAC system must be running at full capacity during recovery time testing. If the system is running at reduced speed or if filters are loaded, recovery time will be longer. Confirm that the system is operating normally and that filters are clean.
Increase air change rate. If recovery time consistently exceeds specification, the HVAC system may be undersized for your Grade A zone volume. Increasing the supply fan speed will increase the air change rate and reduce recovery time. Consult with your HVAC contractor to determine the maximum achievable air change rate.
Aseptic process simulation (APS) involves running your manufacturing process with growth medium instead of product. Any microorganisms present in the environment will grow in the medium. A positive result (visible growth) indicates that your environment is not adequately controlled.
Diagnostic Workflow
Confirm the positive result is real. Growth medium can be contaminated during preparation, sterilization, or handling. Verify that the positive result is due to environmental contamination and not media contamination. Prepare fresh media and repeat the APS run.
Identify the contamination source. If the positive result is confirmed, investigate the source. Common sources include:
Conduct environmental monitoring. Perform microbial air sampling and surface sampling in the Grade A zone to identify the contamination source. This will help you determine whether the problem is airborne, contact, or water-related.
Implement corrective actions. Based on the contamination source, implement corrective actions. These might include:
Repeat APS. After implementing corrective actions, repeat the APS run. All three runs must show zero growth before you can resume manufacturing.
Maintain a log of all test failures, investigations, and corrective actions. This log demonstrates to regulators that you have a systematic approach to problem-solving and that you don’t simply repeat failed tests until they pass.
For each failure, document:
This log is valuable for trend analysis. If you see a pattern (e.g., filters consistently loading faster than expected), you can implement preventive measures (e.g., more frequent filter changes, improved pre-filtration).
Your testing is only as good as the people performing it. Personnel conducting airflow testing must understand the regulatory requirements, the testing procedures, the equipment operation, and the documentation requirements.
Establish a training program that covers:
Training should be documented. Maintain records showing who was trained, what they were trained on, when training occurred, and who conducted the training. Retraining should occur annually and whenever procedures change.
Successful implementation requires more than following procedures. It requires building a culture where environmental control is understood as essential to product quality.
Start with a validation master plan that documents your entire approach. This plan should specify:
Assign clear responsibility. Designate one person as the environmental control owner, someone accountable for maintaining the program, conducting testing, analyzing results, and implementing corrective actions.
Conduct initial qualification thoroughly. Don’t rush. Invest the time to understand your environment’s behavior under various conditions. This baseline knowledge will help you recognize problems in the future.
Establish ongoing monitoring. Airflow doesn’t remain constant, filters load, equipment ages, HVAC components degrade. Periodic re-qualification (typically every three years) confirms that your environment remains controlled.
Document everything. Your testing results are only valuable if you can retrieve them, understand them, and explain them to regulators. A complete file includes:
Applied Physics has helped pharmaceutical and semiconductor manufacturers establish these programs since 1992. The facilities that maintain the most stable, compliant environments are those that treat environmental control as a strategic priority, not a compliance checkbox. They invest in qualified personnel, maintain calibrated instruments, and conduct testing with the rigor that regulators expect.
Maintaining a GMP compliant airflow testing program requires ongoing investment in equipment, training, and documentation. The cost of this investment is far outweighed by the cost of a contaminated batch, a regulatory warning letter, or worse. Applied Physics supports this commitment through precision instrumentation including aerosol photometers, microbial air samplers, and cleanroom foggers designed to deliver the measurement accuracy and reliability that pharmaceutical and semiconductor operations require. Work with a partner that understands your regulatory obligations and provides the tools to meet them consistently. Contact Applied Physics to discuss how our airflow visualization and contamination control solutions can strengthen your environmental qualification program.
| Testing Method | Primary Purpose | Frequency | Pass Criterion |
|---|---|---|---|
| Smoke Study | Visualize airflow patterns and detect dead zones | Initial qualification, after system modifications | Smooth, unidirectional flow toward exhaust |
| Velocity Distribution | Measure airflow speed and uniformity | Annual or per validation protocol | Mean velocity 0.3-0.5 m/s; standard deviation <20% |
| Filter Integrity (AFPT) | Confirm HEPA filter sealing and performance | Annual or after filter replacement | <0.01% penetration |
| Pressure Differential | Monitor isolation barrier between Grade A and adjacent areas | Continuous with alarms | ±10-15 Pa relative to adjacent Grade B |
| Recovery Time | Validate air change rate adequacy | Per validation protocol (typically 3-year cycle) | Return to baseline particle counts within specification |
| Aseptic Process Simulation | Confirm microbial control during actual manufacturing | Annual minimum | Zero growth in all three runs |
GMP compliant airflow testing methods are standardized procedures used to validate that cleanrooms and aseptic processing environments maintain proper airflow patterns, velocity, and contamination control. These methods ensure compliance with cGMP and EU GMP Annex 1 regulations. They include smoke studies (airflow visualization), velocity distribution testing, filter integrity testing, and pressure differential monitoring. These tests are critical because they verify that the facility can prevent microbial contamination and maintain Grade A or ISO 5 environments required for pharmaceutical manufacturing and aseptic processing.
Airflow visualization studies (smoke tests) provide qualitative assessment of flow patterns, showing whether laminar flow is unidirectional and identifying dead zones or turbulence visually. Velocity distribution testing (per ISO 14644-3) provides quantitative measurements of airflow speed in feet per minute (fpm) across the work surface. Both are required under cGMP: smoke studies demonstrate overall flow integrity during IQ/OQ phases, while velocity testing confirms the facility meets the 0.3-0.5 m/s (59-98 fpm) requirement for Grade A environments. Together, they provide complete airflow validation.
Static testing measures airflow when the cleanroom is empty and at rest, typically performed during initial qualification (IQ/OQ). Dynamic testing evaluates airflow during simulated or actual aseptic processing with personnel and equipment present (PQ phase). Dynamic testing is more challenging because personnel movement, equipment placement, and process activity can disrupt laminar flow and increase turbulence. Both are required under cGMP to ensure the facility maintains control under real operating conditions, not just ideal conditions.
Standard equipment includes smoke generators (foggers) for airflow visualization, hot-wire anemometers or vane anemometers for velocity measurement, aerosol photometers for filter integrity testing (AFPT), microbial air samplers for contamination monitoring, and differential pressure gauges for pressure monitoring. Applied Physics offers specialized tools including the Aerosol Photometer BAP-350 for HEPA validation, the Aerosol Generator BAG-6D for filter leak detection, and the Microbial Air Sampler BK-BAS2 for biological contamination assessment. All equipment must be calibrated and documented per validation master plans.
Initial airflow testing is performed during facility qualification (IQ/OQ/PQ phases). Periodic re-testing is typically conducted annually or per regulatory inspection requirements, though frequency depends on facility risk assessment and local regulations. Re-testing is triggered by: facility modifications (HVAC changes, equipment installation), filter replacement, failed microbial or particle monitoring, regulatory inspection findings, or after extended downtime. EU GMP Annex 1 and cGMP require documented evidence of ongoing airflow control, so a risk-based qualification program should define testing frequency based on your specific operation.
Cleanroom qualification (IQ/OQ/PQ) is a comprehensive, one-time validation that documents the facility's ability to meet design specifications and regulatory requirements. It includes airflow visualization, velocity distribution, filter integrity, pressure differential, and aseptic process simulation testing. Routine monitoring (annual or periodic) uses a subset of these tests to verify ongoing compliance. Qualification is intensive and documented in a validation master plan; routine monitoring is faster and less costly. Both are required under cGMP, but qualification establishes the baseline against which routine results are compared.
Airflow testing validates that the cleanroom environment can achieve and maintain the low contamination levels required for aseptic processing. A contamination control strategy uses airflow testing results (unidirectional flow, velocity, recovery time after disruption) to define acceptable operating limits. It combines airflow data with microbial monitoring, particle counts, and aseptic process simulation results to demonstrate that the facility can reliably prevent contamination. Under EU GMP Annex 1 and cGMP, this integrated strategy must be documented and reviewed during regulatory inspections.
This article was written using GrandRanker

Enter your details below to save your shopping cart for later. And, who knows, maybe we will even send you a sweet discount code :)
Allow notifications to get real-time updates about your shopping cart and who knows, you may even receive a sweet discount code 😊