Last Updated: July 25, 2026
ISO 14644 standards define cleanroom performance through particle count limits and airflow requirements that determine contamination control effectiveness. According to ISO 14644-1 Cleanroom Classification Standards, these standards specify the precise conditions necessary for compliance. Applied Physics has worked with cleanroom operators for over three decades to help them understand how these classifications translate into daily operational requirements.
ISO 14644 classifies cleanrooms from Class 1 (most stringent) to Class 9 (least stringent), with each class defining maximum allowable particle concentrations at specific micron sizes. A Class 5 cleanroom, common in pharmaceutical manufacturing and semiconductor production, must maintain particle counts below 3,520 particles per cubic meter at 0.5 microns.
Each ISO class carries specific air change rate requirements that directly impact how you maintain cleanroom air patterns. ISO Class 5 facilities typically require 240 to 480 air changes per hour (ACH), meaning the entire volume of air cycles through HEPA filtration multiple times each hour. A Class 7 cleanroom might operate at 90-120 ACH, while a Class 8 operates at 20-40 ACH. Understanding your facility’s classification determines your entire maintenance protocol.
The physical design of your cleanroom determines whether maintaining ISO cleanroom air patterns is manageable or a constant struggle. Cleanroom air patterns must move contamination out of the critical zone toward exhaust points without creating dead zones or turbulent eddies where particles settle. Ceiling-mounted HEPA filters in unidirectional flow designs push clean air down toward the floor, where return air grilles pull it back through the filtration system.
Room geometry matters enormously. Corners, alcoves, and irregular surfaces create air pattern disruptions. The best cleanroom designs minimize obstacles in the critical work area, use sloped ceilings to direct airflow, and position return air grilles strategically to capture all exhaust air before recirculation. Facilities with thoughtful design spend 30-40% less on energy and maintenance than those retrofitting older spaces.
Laminar airflow, also called unidirectional flow, moves air in parallel lines at uniform velocity from ceiling filters to floor return grilles. This creates a predictable, stable air pattern that sweeps particles directly out of the space. Turbulent flow uses distributed ceiling-mounted return air grilles, creating multiple circulation paths that are less efficient but more forgiving of equipment placement and personnel movement.
Most ISO Class 8 and Class 9 cleanrooms use turbulent flow because lower contamination control requirements don’t justify unidirectional system costs. Laminar flow systems are sensitive to obstruction; a misplaced cart or person standing in front of a return air grille can disrupt the entire pattern. When maintaining ISO cleanroom air patterns in a laminar flow system, you’re protecting a delicate airflow structure. When maintaining patterns in a turbulent system, you’re managing multiple circulation paths and ensuring none become stagnant.
Positive air pressure is your cleanroom’s first line of defense against contamination ingress. When your cleanroom maintains higher air pressure than adjacent spaces, air naturally flows outward through any openings, preventing unfiltered air from entering.
Pressure differential is typically maintained at 0.02 to 0.05 inches of water column above adjacent spaces. This modest pressure difference prevents infiltration while avoiding excessive energy consumption. Maintaining positive pressure means monitoring differential pressure sensors regularly, inspecting door seals and pass-throughs for leaks, and ensuring your HVAC system has adequate capacity to maintain the setpoint.
HEPA filters remove 99.97% of particles 0.3 microns and larger, which is why they’re non-negotiable in any ISO Class 6 facility or better. The question isn’t whether you’ll need to replace HEPA filters, it’s whether you’ll replace them proactively or reactively. Proactive replacement follows a schedule based on air change rate, facility activity, and filter loading.
Typical HEPA filter life in a busy semiconductor fab is 6-12 months. In a lower-activity pharmaceutical cleanroom, filters might last 18-24 months. The determining factor is filter loading.
Filter integrity testing is the only way to know if a HEPA filter is actually removing particles at its rated efficiency. The standard method is the DOP (dioctyl phthalate) test, where an aerosol is introduced upstream of the filter and particle counts are measured downstream. If downstream particle counts exceed 0.003% of upstream levels, the filter has failed and must be replaced immediately.
Replacement schedules should account for your facility’s specific conditions. Start with the filter manufacturer’s recommended life, typically 12-24 months for standard HEPA filters in cleanrooms. Then adjust based on actual data. Track pressure differential readings over time; when differential reaches 80% of your replacement threshold, schedule the change.
Applied Physics provides [Aerosol Photometer BAP(/products/aerosol-photometer-bap-350/)-350 for HEPA validation | appliedphysicsusa.com/products/aerosol-photometer-bap-350/] equipment that enables rapid, accurate filter integrity testing.
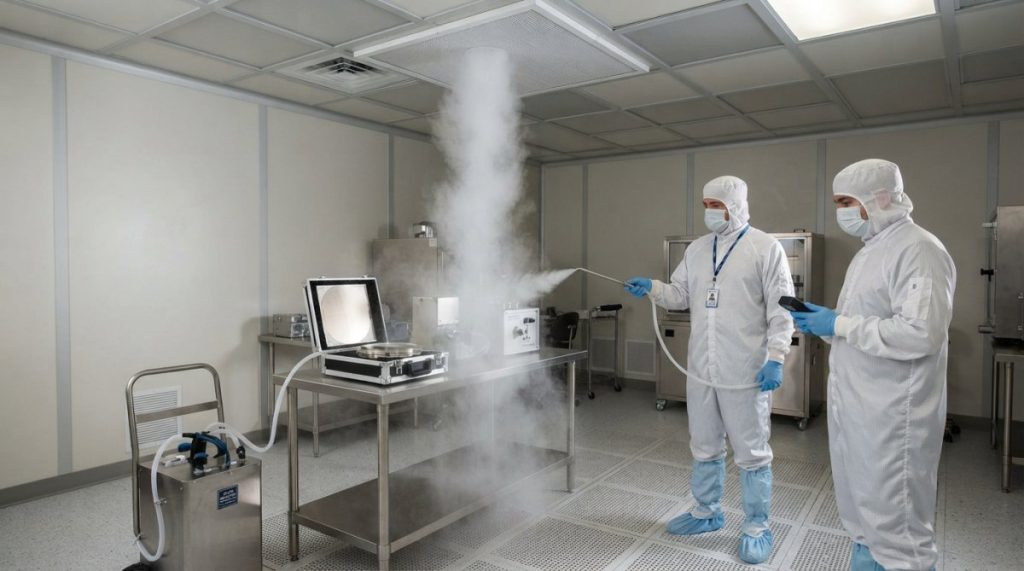
Seeing is believing when it comes to cleanroom air patterns. Airflow visualization uses visible aerosol to trace how air actually moves through your space, revealing patterns that sensors alone cannot detect.
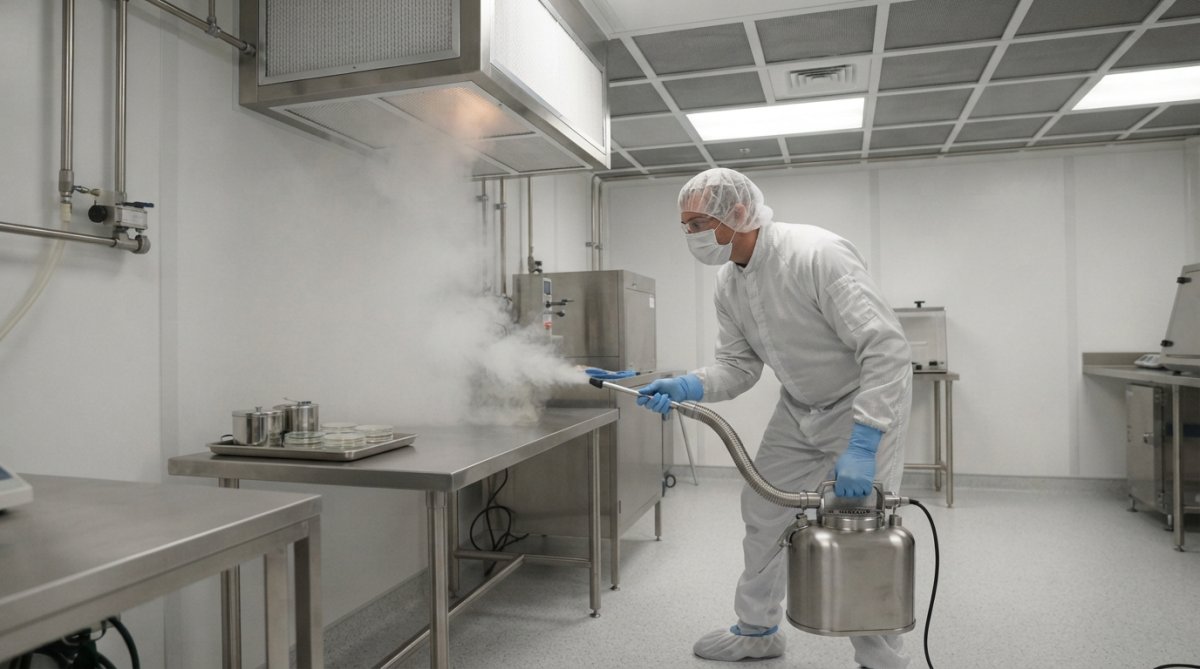
Airflow visualization serves two distinct purposes: validation and routine monitoring. Validation studies are comprehensive, performed during initial commissioning or after major modifications, and documented extensively for regulatory compliance. Routine monitoring is faster, less formal, and performed regularly to ensure patterns remain stable.
A smoke study involves introducing a visible aerosol into the cleanroom and observing how it moves. In a properly functioning laminar flow system, smoke should move in straight, parallel lines from the ceiling filter toward the floor return. In a turbulent flow system, smoke should circulate smoothly without stagnant zones or reverse flow.
You introduce smoke at various points in the cleanroom, at work surfaces, near equipment, and in corners. You observe whether smoke moves predictably toward exhaust points or whether it pools, swirls, or moves upstream. Equipment obstructing the filter face causes localized dead zones. Personnel standing in the path creates turbulence.
Applied Physics provides Aerosol Generator-[Cold Type BAG](https://vertexaisearch.cloud.google.com/grounding-api-redirect/AUZIYQEPDmgsskt175X8RGvoscgpVq89WwW5PBlqfucTHnh3uxzxwhaxpO49wabTSocOaxSYA2Ka6CvDpgGuE2HRivgKxh5fX_9ux1NYwIT_GpBgg8p1eclAspOB5Cj7yrSt7xY6sOQCCFc4enobaKSBO8qo(/products/aerosol-generator-cold-type-bag-4b/)-4B for cleanroom smoke studies | appliedphysicsusa.com/products/aerosol-generator-cold-type-bag-4b/] that generates consistent, visible aerosol without introducing heat or moisture that could disrupt the patterns you’re trying to visualize.
Validation studies are comprehensive, documented, and performed under controlled conditions. They’re performed during initial commissioning, after facility modifications, after major maintenance, or as part of regulatory compliance. Validation studies typically take 4-8 hours and involve multiple smoke introduction points with detailed documentation.
Routine monitoring is faster and less formal. You perform a quick smoke study, perhaps 30-60 minutes, to verify that air patterns remain stable. Routine monitoring focuses on critical areas: the direct path from filters to return air grilles, work surfaces where product is exposed, and areas where personnel frequently stand.
The frequency of routine monitoring depends on your facility’s risk profile and regulatory requirements. Pharmaceutical cleanrooms typically perform routine monitoring monthly or quarterly. Semiconductor fabs might perform it monthly. Documentation differs too. Validation studies produce formal reports with photographs and measurements. Routine monitoring might be as simple as a logbook entry.
Daily maintenance of cleanroom air patterns is a series of checks and adjustments that keep your system stable.
Begin your day by reviewing particle count data from your continuous monitoring system. You’re looking for whether counts are within specification and whether there’s a trend. A single elevated reading might indicate a transient event. A sustained elevation indicates a systemic problem: filter degradation, air pattern disruption, or a contamination source you haven’t identified.
Document the data. Record particle counts at specific size thresholds (0.5 micron, 1 micron, 5 micron) because different contamination sources produce different particle size distributions.
Air change rate is calculated by dividing the volume of air supplied per minute by the volume of the cleanroom. Velocity is the speed at which air moves through the space, typically measured in feet per minute (fpm).
Measure these monthly or whenever you suspect air pattern problems. Use a calibrated anemometer to measure velocity at multiple points across the filter face. Declining velocity indicates filter loading. If your velocity drops 10-15% below specification, your filter is nearing end-of-life.
Check your pressure differential sensor first thing in the morning, before the facility becomes active. Record the reading. It should be within your facility’s specification, typically 0.02-0.05 inches of water column above adjacent spaces.
If differential is low, investigate the cause. Check door seals for visible gaps or damage. Inspect pass-throughs and material transfer ports. Perform a pressure decay test: seal the cleanroom and measure how quickly pressure drops.
Create a simple log, digital or paper, that records daily observations. Include date, time, particle counts at relevant thresholds, pressure differential, any anomalies observed, and any maintenance performed. This log becomes your facility’s history and is invaluable for troubleshooting problems.
| Monitoring Task | Frequency | What to Record | Action If Out of Spec |
|---|---|---|---|
| Particle count review | Daily | Counts at 0.5µm, 1µm, 5µm | Investigate source; schedule filter test |
| Air velocity check | Monthly | fpm at 4-6 points on filter face | Plan filter replacement |
| Pressure differential | Daily | Inches of water column | Check for leaks; test HVAC capacity |
| Smoke study | Monthly (routine) | Visual airflow pattern; anomalies noted | Document findings; plan corrective action |
| Filter integrity test | Annually or as needed | Pass/fail; particle penetration % | Replace filter immediately if failed |
Cleanroom air patterns fail for identifiable reasons. Understanding the common causes and how to diagnose them is the difference between managing problems and being managed by them.
Filter degradation is the most common cause. As HEPA filters accumulate dust, their resistance increases. Your HVAC system compensates by increasing supply volume, but eventually it reaches maximum capacity. When this happens, velocity drops and your ability to sweep particles out of the space diminishes. The solution is straightforward: replace the filter.
Equipment obstruction is the second most common cause. A misplaced cart or newly installed machine can block the direct path from ceiling filters to return air grilles, creating a dead zone where particles accumulate. HVAC system problems, damper failures, fan belt degradation, or ductwork blockages reduce supply volume directly. Seal failures around doors, windows, or penetrations allow unfiltered air to enter.
Personnel activity is the most controllable cause. Every time someone enters the cleanroom, they bring particles. Every movement generates particles. Every door opening disrupts pressure differential.
Personnel are mobile contamination sources. A person in a cleanroom generates approximately 100,000 to 1,000,000 particles per minute depending on activity level. Walking generates more particles than standing still. The impact on air patterns is twofold. First, personnel generate particles that your air pattern must remove. Second, personnel movement disrupts the air pattern itself.
Minimizing personnel impact requires training, discipline, and facility design. Train personnel to move slowly and deliberately. Restrict unnecessary movement. Position work areas to minimize the path personnel must travel. Some facilities use real-time particle monitoring with visual alerts. When personnel movement causes a localized spike in particle counts, the operator sees it immediately and adjusts their behavior.
Cleanrooms are energy-intensive facilities. However, many cleanroom facilities waste energy through poor maintenance practices or design choices that don’t align with actual requirements.
The first efficiency opportunity is matching your air change rate to your actual requirement. Calculate your actual minimum ACH requirement based on your ISO class and facility size. The second opportunity is filter management. Replacing filters before they’re truly necessary wastes money and energy. The third opportunity is addressing pressure differential losses. Sealing door leaks and repairing damaged seals can reduce your energy consumption by 10-15%. The fourth opportunity is optimizing your cleanroom schedule. If your facility doesn’t require 24/7 operation, reducing operating hours during low-activity periods saves substantial energy.
Cleanroom surfaces accumulate particles and microorganisms despite your best air pattern maintenance. Regular cleaning removes these contaminants and prevents them from becoming airborne when air patterns are disrupted.
The cleaning protocol depends on your facility’s requirements. Pharmaceutical cleanrooms typically require daily or weekly cleaning with disinfectants. Semiconductor cleanrooms might require weekly or monthly cleaning with specific solvents. The key principle is that cleaning must not disrupt air patterns. You clean when the cleanroom is not in use, or you use techniques that minimize particle generation. Wet cleaning generates fewer particles than dry wiping.
The most common mistake is assuming that cleanroom air patterns are static. They change as filters load, as equipment is moved, and as HVAC systems age. Successful facilities maintain air patterns continuously.
The second mistake is over-reliance on particle count data without understanding what causes those counts. Investigate the root cause before taking action. The third mistake is ignoring pressure differential trends. A slow decline over weeks indicates a developing problem. The fourth mistake is inadequate personnel training. Cleanroom protocols only work if personnel follow them consistently. The fifth mistake is deferring filter replacement because you’re hoping to extend filter life. Running filters past their useful life doesn’t extend their life, it damages your HVAC system and compromises contamination control.
Maintaining cleanroom air patterns is fundamentally about understanding your facility’s design, monitoring its performance continuously, and addressing problems before they become failures. The tools and techniques described here, particle counting, pressure monitoring, airflow visualization, and filter management, are standard across the industry. What distinguishes successful facilities from struggling ones is consistency and discipline.
If your facility is struggling to maintain stable air patterns, the solution often isn’t more equipment or higher technology. It’s better execution of the fundamentals: regular monitoring, prompt response to anomalies, and disciplined personnel behavior. Applied Physics provides the equipment and expertise to help you visualize and validate your air patterns with confidence. Whether you’re commissioning a new cleanroom or troubleshooting problems in an existing one, understanding the principles in this guide will help you maintain the contamination control your operation requires.
Validation is a one-time or periodic comprehensive assessment conducted during cleanroom commissioning or after major modifications. It uses rigorous testing methods like aerosol photometry and particle counting to confirm compliance with ISO 14644 standards. Routine monitoring is the ongoing daily or weekly surveillance of particle counts, air change rates, and pressure differentials to ensure sustained compliance. Validation proves the system works correctly; routine monitoring confirms it stays compliant during active use.
Personnel create turbulence and generate particulate matter through body heat, movement, and shedding. This disrupts laminar airflow patterns and can introduce contaminants. Minimize impact by limiting personnel in the cleanroom, requiring proper gowning procedures, controlling movement speed, and maintaining adequate air change rates (typically 15-20 ACH for ISO Class 7, up to 240+ ACH for ISO Class 5). Position personnel downstream of critical work areas and use barriers or isolators when handling sensitive materials.
Particle count thresholds vary by ISO classification. ISO Class 5 allows ≤3,520 particles/m³ ≥0.5 µm; ISO Class 6 allows ≤35,200 particles/m³; ISO Class 7 allows ≤352,000 particles/m³. If counts exceed these limits, air patterns are compromised. Use an aerosol photometer or particle counter to monitor continuously. Exceedances typically signal HEPA filter degradation, inadequate air change rates, or pressure differential loss. Conduct immediate troubleshooting and consider filter replacement.
Balance energy use with compliance by optimizing air change rates based on actual ISO classification needs rather than over-sizing systems. Use variable frequency drives (VFDs) on fan units to adjust airflow dynamically. Maintain HEPA filters regularly to prevent pressure drop and motor strain. Seal gaps and leaks in the cleanroom envelope to reduce wasted airflow. Install smart monitoring systems that alert you to efficiency losses. Modern FFU designs with microprocessor controls can reduce energy consumption while sustaining unidirectional airflow and positive pressure.
This article was written using GrandRanker

Enter your details below to save your shopping cart for later. And, who knows, maybe we will even send you a sweet discount code :)
Allow notifications to get real-time updates about your shopping cart and who knows, you may even receive a sweet discount code 😊