Last Updated: July 26, 2026
Advanced airflow testing for biotech has become non-negotiable in modern pharmaceutical and biopharmaceutical manufacturing. According to the FDA’s latest guidance on aseptic processing environments, airflow failures account for a significant portion of contamination-related product recalls in the United States. At Applied Physics, we’ve spent three decades helping biotech facilities validate and maintain cleanroom environments where even microscopic failures can compromise entire batches. Below, we’ll show you exactly how to implement advanced airflow testing for biotech that meets USP <797> and ISO 14644 standards while catching problems before they become costly shutdowns.
The challenge most facilities face isn’t understanding airflow testing, it’s knowing which tests actually matter for their specific operation and how to integrate them into a continuous monitoring program that doesn’t cripple production. This guide covers the methodology, equipment, regulatory requirements, and practical troubleshooting steps that separate compliant operations from those constantly fighting validation issues.
Advanced airflow testing for biotech is a comprehensive set of techniques and measurements that verify cleanroom environments maintain the proper directional flow, velocity, and particle control necessary for aseptic processing. Unlike basic airflow checks, advanced testing combines smoke visualization, quantitative velocity measurements, particle counting, and microbial monitoring into an integrated validation program.
The core principle is simple: uncontrolled or turbulent airflow allows contamination to drift into critical processing areas. Directional, laminar airflow at specified velocities protects product by sweeping contaminants away from work surfaces and toward HEPA filters. Advanced airflow testing for biotech validates that this protection actually exists under real operating conditions, not just on paper.
Most biotech facilities approach this reactively: they test when regulators ask, or after a contamination event. The facilities that maintain zero contamination incidents test continuously, using real-time monitoring systems integrated with their building management infrastructure. That shift from reactive to predictive is where advanced airflow testing for biotech delivers its actual value.
Contamination in aseptic processing doesn’t just waste product, it creates liability. A single batch of contaminated injectable product can reach thousands of patients. The FDA’s enforcement actions against biotech manufacturers almost always cite airflow or environmental monitoring failures as root causes.
But the real cost goes deeper. Many facilities don’t quantify the hidden expense of inadequate airflow testing: unplanned shutdowns for remediation, repeated failed batches during validation campaigns, extended investigations that delay product launches, and the staffing overhead of constant troubleshooting. Facilities with strong advanced airflow testing for biotech programs experience fewer surprises. Their validation studies take less time because the environment is already optimized. Their regulatory inspections move faster because documentation is comprehensive and consistent.
The numbers tell a clear story. Facilities that implement continuous airflow monitoring report 40-60% fewer environmental monitoring failures during routine operations compared to those relying on periodic testing alone. This isn’t coincidence, it’s because continuous data reveals drift patterns that periodic snapshots miss entirely.
ISO 14644 is the international standard that defines cleanroom classification, and it’s the foundation for all advanced airflow testing for biotech. The FDA references ISO 14644 in guidance documents, and USP <797> aligns with its principles for compounding environments. Understanding the classification system is essential because your facility’s ISO class determines which airflow velocities, particle counts, and testing frequencies apply.
ISO 14644 defines nine cleanroom classes (ISO Class 1 through ISO Class 9) based on particle concentration limits. Biotech aseptic processing typically operates in ISO Class 5 (critical areas where product is exposed) or ISO Class 7 (supporting areas). Each class has strict limits on particles 0.5 micrometers and larger per cubic meter.
ISO Class 5 environments must maintain no more than 3,520 particles ≥0.5 μm per cubic meter during dynamic (operational) conditions. That’s extraordinarily clean, roughly one-millionth of ambient air cleanliness. Achieving and maintaining this requires precise control over airflow direction, velocity, and uniformity across the entire work surface.
The classification isn’t arbitrary. Particle concentration correlates directly with contamination risk. A facility operating at ISO Class 6 instead of ISO Class 5 sees exponentially higher microbial contamination rates during actual product operations. The cost of upgrading airflow systems to achieve true ISO Class 5 performance is far less than the cost of product recalls.
Pressure differential, the slight positive or negative pressure maintained between adjacent rooms, is your first line of defense against contamination migration. ISO 14644 doesn’t mandate specific pressure differentials, but USP <797> and FDA guidance require that critical areas maintain positive pressure relative to less-clean surrounding spaces.
Typical specifications for biotech facilities:
Air change rate, how many times the entire room volume is replaced with filtered air per hour, directly impacts particle removal and airflow uniformity. ISO Class 5 areas typically require 20-30 air changes per hour (ACH) minimum, though many facilities operate at 40+ ACH to ensure margin.
Higher air change rates improve contamination control but increase energy costs and equipment wear. Advanced airflow testing for biotech helps you find the minimum air change rate that reliably maintains your ISO class during actual operations. Many facilities discover they can optimize ACH downward after detailed airflow studies, reducing energy consumption without compromising compliance.
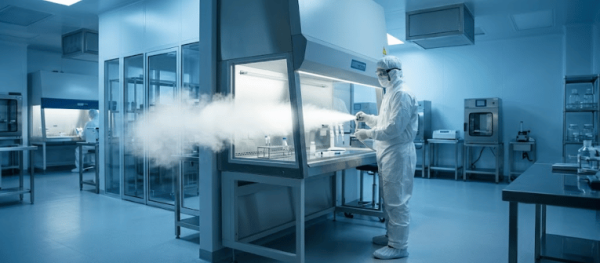
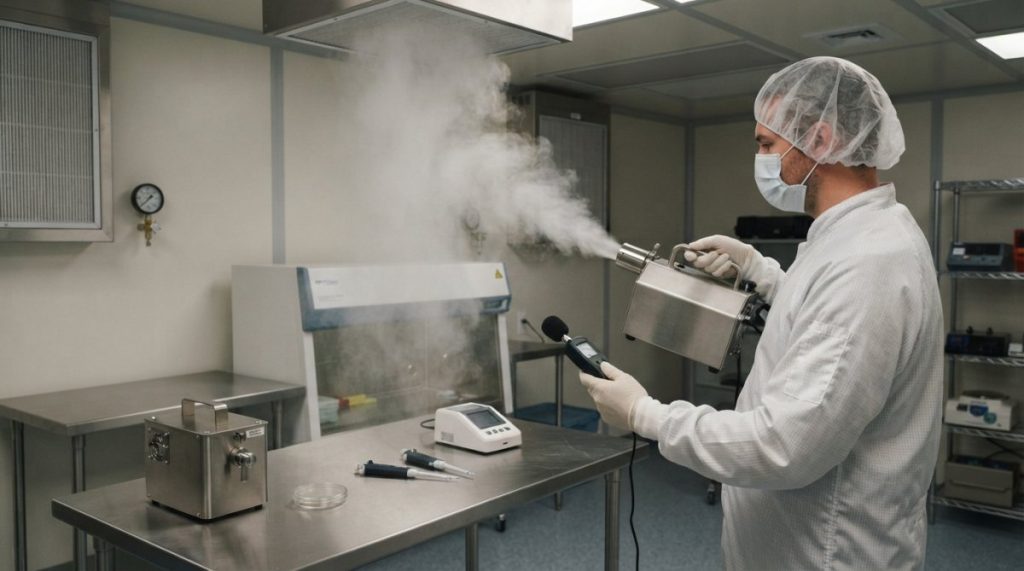
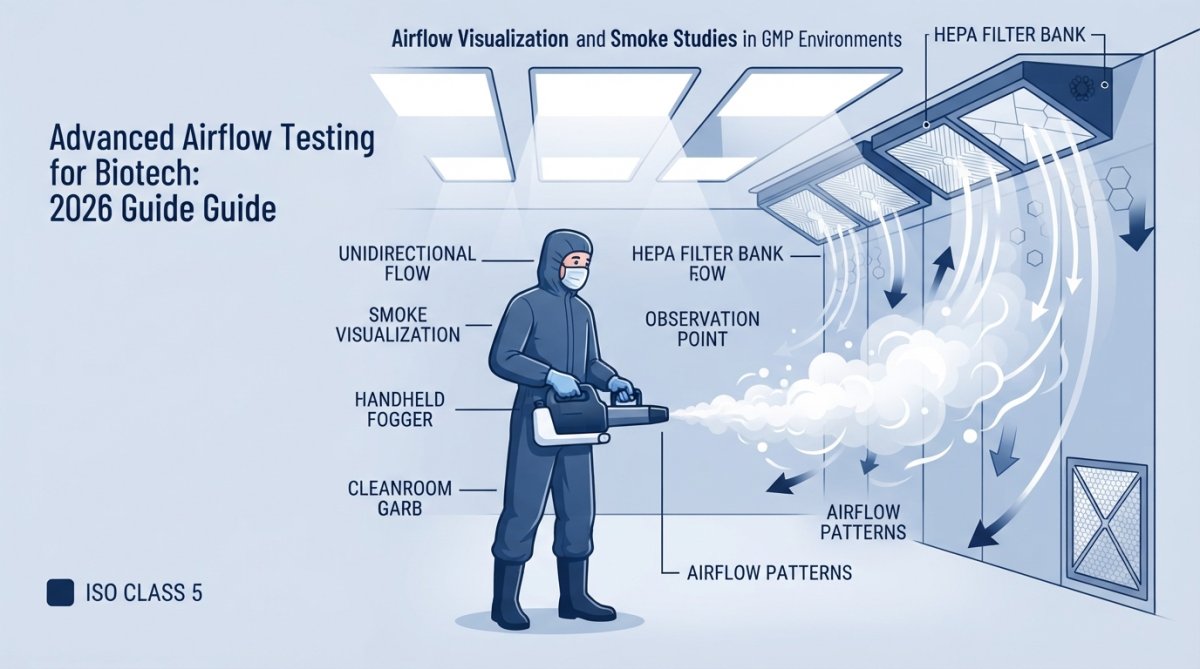
Smoke studies are the gold standard for visualizing airflow patterns in cleanrooms. Unlike instruments that measure velocity at discrete points, smoke visualization reveals the complete three-dimensional flow pattern, including eddies, dead zones, and turbulent regions that instruments might miss.
A smoke study involves introducing tracer smoke (typically from a fog generator using dry ice or ultrasonic nebulization) into the cleanroom and observing how it moves through the space. The smoke should follow a smooth, unidirectional path from supply air toward exhaust, without swirling, stalling, or reversing direction. Any deviation signals a problem: improper supply geometry, obstructed return air, equipment placement that disrupts flow, or inadequate velocity.
Turbulent airflow is the enemy of contamination control. Instead of sweeping contaminants away from product, turbulent flow creates eddies where particles and microorganisms can accumulate. Smoke studies make turbulence immediately visible, you see the smoke swirl, reverse direction, or pool in corners instead of flowing smoothly toward exhaust.
Common undesirable patterns include:
Dead zones appear as areas where smoke stalls or moves very slowly. These typically occur behind equipment, in corners, or below work surfaces where supply air can’t reach. Microorganisms can settle in dead zones and potentially contaminate product if air eventually carries them toward the critical area.
Recirculation patterns happen when exhaust air re-enters the supply side, carrying contamination back into the cleanroom. You’ll see smoke moving toward exhaust, then curling back toward the work surface. This is often caused by supply and exhaust being too close together or exhaust velocity being too low.
Velocity gradients appear as smoke moving at different speeds in different zones. If smoke races across one side of the room but crawls across the other, you have a velocity uniformity problem. ISO 14644 requires velocity uniformity within ±20% across the critical work surface.
Directional failure occurs when smoke doesn’t move consistently from supply to exhaust. Instead, it drifts sideways, moves upward when it should move downward, or follows an erratic path. This indicates the supply air geometry or return air configuration isn’t creating the intended unidirectional flow.
Static testing occurs with the cleanroom unoccupied and no equipment running except the HVAC system. Dynamic testing includes personnel, equipment, and simulated operational activity. Both are required for full validation, but they reveal different problems.
Static testing establishes the baseline: what the airflow looks like under ideal conditions. If static testing fails, if smoke studies show turbulence or dead zones even with no operational disruption, the facility has a fundamental design or equipment problem that must be fixed before any product operations.
Dynamic testing reveals how real operations disrupt that baseline. Personnel moving through the room, equipment running, doors opening, material transfers, all of these create air disturbances that can degrade airflow. A facility might pass static testing perfectly but fail dynamic testing because normal operations create eddy currents around equipment or personnel.
Advanced airflow testing for biotech requires both. Static testing validates your design. Dynamic testing validates that your design survives contact with reality.
HEPA filters are the last barrier between your product and contamination. A single pinhole leak in a HEPA filter can compromise an entire cleanroom’s particle control. That’s why HEPA filter integrity testing is non-negotiable in advanced airflow testing for biotech.
HEPA filters remove 99.97% of particles 0.3 micrometers and larger under ideal conditions. But filters degrade over time, particulate load increases, media can tear, and seals can fail. Testing validates that your filters are still performing at specification and identifies failures before they cause contamination.
The traditional method is DOP (dioctyl phthalate) testing, also called photometric testing. A test aerosol of DOP particles is introduced upstream of the filter. A photometer measures particle concentration downstream. If the downstream reading is less than 0.01% of the upstream reading, the filter passes. Anything higher indicates a leak.
DOP testing is effective but has limitations. It’s labor-intensive, requires specialized equipment, and can only be performed during specific maintenance windows (not during operations). Many facilities are transitioning to alternative methods like polydisperse aerosol testing (PAT) or laser particle counting, which offer similar sensitivity with less disruption.
The critical measurement is penetration rate, the percentage of upstream particles that pass through the filter. For biotech applications, penetration must be less than 0.01% (equivalent to 99.99% efficiency). Any filter showing penetration above this threshold must be replaced immediately.
Frequency matters. Initial HEPA filter integrity testing occurs during cleanroom qualification. Routine testing typically happens annually or after any maintenance that disturbs the filter. Some facilities test more frequently (quarterly) if they operate in high-particulate environments or if historical data shows rapid filter loading.
Cleanroom certification is the formal process of demonstrating that your facility meets design specifications and regulatory requirements. It’s not a one-time event, it’s an ongoing program with initial qualification, periodic requalification, and continuous monitoring.
Advanced airflow testing for biotech is the foundation of certification. You can’t certify a cleanroom without proving that airflow meets specifications. But certification also requires particle counting, microbial monitoring, pressure differential verification, and documentation that ties everything together.
Performance Qualification (PQ) is the final stage of commissioning, where you demonstrate that the cleanroom performs as designed under actual operating conditions. PQ includes dynamic smoke studies, particle counts during simulated operations, microbial sampling, and pressure differential monitoring over an extended period (typically 3-5 days of continuous operation).
PQ is rigorous because it’s your baseline. Every future test is compared against PQ results. If particle counts during routine monitoring exceed PQ levels, you have a problem that must be investigated and corrected.
Routine certification intervals depend on regulatory requirements and risk assessment. USP <797> requires annual certification for compounding pharmacies. Pharmaceutical manufacturers typically certify every 6-12 months, depending on facility criticality and historical performance. Some facilities operating under FDA oversight may be required to certify more frequently (quarterly) if they’ve had contamination incidents.
The documentation burden is substantial. Each certification requires:
This documentation is what regulators review during inspections. Incomplete or missing documentation is a warning letter waiting to happen.
| Certification Element | Frequency | Key Measurement | Pass Criteria |
|---|---|---|---|
| Smoke Studies | Annual (minimum) | Airflow pattern visualization | No turbulence, dead zones, or recirculation |
| Particle Counts | Annual (minimum) | Particles ≥0.5 μm per m³ | ≤3,520 for ISO Class 5 (dynamic) |
| HEPA Integrity | Annual (minimum) | Penetration rate | <0.01% (99.99% efficiency) |
| Pressure Differential | Continuous monitoring | Inches of water column | +0.02 to +0.05 for critical areas |
| Microbial Sampling | Monthly (routine) | CFU per sample | <1 CFU per 10 liters for ISO Class 5 |
The quality of your airflow testing depends entirely on the equipment you use. Cheap instruments produce unreliable data. Poorly calibrated equipment gives you false confidence in a system that’s actually failing. Advanced airflow testing for biotech requires precision instruments maintained in rigorous calibration programs.
Particle counters measure airborne particle concentration by drawing air through an optical sensor that detects individual particles. Most biotech applications use optical particle counters capable of detecting particles as small as 0.3 micrometers. The counter must be calibrated annually against a traceable standard (NIST-certified calibration).
Air samplers collect microbial samples from the cleanroom environment. Active samplers draw a known volume of air through an agar plate or collection medium, capturing microorganisms present. Passive samplers (settle plates) sit in the room and collect particles that fall due to gravity. Both methods are required, active sampling detects airborne microorganisms, passive sampling detects settling contamination.
Velocity measurement devices (anemometers) measure air speed at specific points. For advanced airflow testing for biotech, you need a hot-wire anemometer or vane anemometer capable of measuring low velocities (0.3-1.0 m/s is typical for cleanrooms) with ±5% accuracy. The instrument must have been calibrated within the last 12 months.
Applied Physics offers the Aerosol Photometer BAP-350 for HEPA validation and cleanroom certification, along with the [Microbial Air Sampler BK-BAS2](https://appliedphysicsusa.com/products/microbial-air-sampler-bk-bas2/) for biological monitoring. These instruments are designed specifically for GMP environments and provide the precision required for regulatory compliance.
For facilities requiring portable microbial sampling in ISO 5 and ISO 7 zones, the P100ss Air Sampler offers fully stainless steel construction that withstands repeated sterilization and cleaning cycles.
The actual testing process follows a structured protocol. Skipping steps or cutting corners creates gaps in your data that regulators will find during inspections. The methodology must be documented in a protocol before testing begins, and deviations must be recorded and justified.
1. Pre-test preparation (1-2 days before):
Verify that all instruments are calibrated and functioning. Check that the cleanroom is in its normal operational state, all equipment running, HVAC systems at design settings, doors sealed. Establish baseline conditions: temperature, humidity, pressure differential. Document the date, time, personnel involved, and any deviations from normal operations.
2. Smoke study execution (2-4 hours):
Introduce tracer smoke at supply air locations and observe movement toward exhaust. Smoke should follow a smooth, unidirectional path. Photograph or video-record the smoke pattern from multiple angles. Note any areas where smoke stalls, swirls, or reverses direction. Test both with and without personnel present (static and dynamic conditions).
3. Velocity measurements (2-3 hours):
Using a calibrated anemometer, measure air velocity at a grid of points across the critical work surface. Typically, this means measuring at 12-25 locations depending on room size. Record all readings and calculate average velocity and uniformity (standard deviation). Velocity should be 0.3-1.0 m/s for unidirectional flow, with uniformity within ±20%.
4. Particle counting (4-8 hours):
Position calibrated particle counters at multiple locations (supply air, critical work surface, exhaust). Draw samples at specified intervals (typically every 30 minutes for 4-8 hours) and record particle counts at multiple size ranges (0.5 μm, 1 μm, 5 μm). Calculate average concentrations and compare against ISO Class limits.
5. Microbial sampling (4-24 hours):
Place active air samplers and passive settle plates at designated locations. Run active samplers for specified durations (typically 250-500 liters of air). Incubate plates at 35°C for 24-48 hours, then count colonies. Record all results and identify any microorganisms present.
6. Pressure differential monitoring (continuous, 24 hours):
Install differential pressure transducers across room boundaries. Monitor and record pressure differential at 15-minute intervals for 24 hours. Pressure should remain positive relative to adjacent spaces and within specification (±0.01 inches of water column).
7. Data analysis and reporting (1-2 days):
Compile all data, calculate averages and standard deviations, compare against acceptance criteria. Identify any out-of-specification results. Document corrective actions taken. Prepare final report with tables, graphs, and photographs.
The data itself is worthless without proper analysis. You’re looking for trends, not just single snapshots. A particle count that’s slightly high on one day might be random variation. A particle count that’s consistently creeping upward over months signals a problem developing.
This is where many facilities fail. They collect data but don’t analyze it systematically. They compare results only to pass/fail criteria, not to historical trends. Advanced airflow testing for biotech requires tracking metrics over time and establishing alert thresholds that trigger investigation before actual failures occur.
Create a data dashboard that tracks:
When any metric shows a trend toward failure (particle counts rising, pressure differential drifting downward, velocity uniformity declining), investigate immediately. Often the fix is simple, a HEPA filter nearing end-of-life, a damper that needs adjustment, or an obstruction in return air. Catching these issues through trend analysis prevents contamination events.
The future of advanced airflow testing for biotech isn’t periodic manual testing conducted once or twice per year. It’s continuous automated monitoring integrated with your facility’s Building Management System (BMS), where real-time data from pressure differential sensors, temperature/humidity probes, and particle counters feeds into a centralized platform that alerts you to problems immediately instead of weeks later when you finally run a quarterly test.
Integration transforms airflow testing from a compliance activity into an operational control system. Instead of discovering that pressure differential dropped three days ago during a routine test, you know about it in real time and can investigate before contamination occurs. Instead of waiting for annual certification to learn that particle counts are trending upward, you see the trend developing over weeks and can schedule preventive maintenance before failure.
Implementing continuous monitoring requires installing permanent sensors at strategic locations throughout your facility. The sensor network typically includes:
Pressure differential transducers at every room boundary that matters. For a typical biotech facility with an ISO Class 5 critical area, ISO Class 7 buffer, and non-classified support spaces, you need transducers measuring:
Each transducer should have ±0.01 inches of water column accuracy and should be calibrated annually. The sensor should be installed in a stable location away from vibration or thermal gradients that could affect readings.
Temperature and humidity probes in supply air, return air, and critical work areas. These measure environmental conditions that affect airflow behavior. Air density changes with temperature; humidity affects particle behavior. Typical specifications:
Optical particle counters (fixed installation) in critical areas and return air. Fixed counters differ from portable counters in that they continuously sample air and log data automatically. They’re more expensive than portable counters ($15,000-30,000 per unit) but provide continuous visibility into particle trends. Most facilities install at least one fixed counter in the critical area and one in return air.
Air velocity probes (optional but increasingly common) at supply air outlets and critical work surfaces. These measure airflow velocity in real time, allowing you to detect velocity degradation before it causes contamination. Velocity probes are less common than pressure transducers because they’re more expensive and require more maintenance, but they provide valuable data for facilities with complex airflow patterns.
Microbial air samplers (optional) can be integrated with BMS for automated sampling. These are less common than other sensors because microbial analysis requires incubation time (24-48 hours), so real-time alerts aren’t possible. However, some facilities use automated samplers that collect samples at scheduled intervals, then incubate and analyze them offline. This provides continuous microbial data without manual sampling.
Once sensors are installed, they must communicate with your BMS. The most common integration methods are:
Modbus RTU/TCP: An industrial standard protocol that allows sensors to send data to a central controller. Most modern BMS platforms support Modbus. Advantages: widely supported, reliable, mature technology. Disadvantages: requires dedicated wiring or network infrastructure.
OPC UA (OLE for Process Control Unified Architecture): A newer standard that allows real-time data exchange between industrial devices and software platforms. OPC UA is more flexible than Modbus and supports more complex data structures. Advantages: supports cloud integration, better security, more sophisticated data analysis. Disadvantages: more complex to implement, requires more IT infrastructure.
MQTT (Message Queuing Telemetry Transport): A lightweight protocol increasingly used for IoT applications. MQTT allows sensors to publish data to a broker, which then distributes it to subscribers (your BMS, data analytics platforms, etc.). Advantages: lightweight, supports cloud integration, good for facilities with distributed sensors. Disadvantages: requires more IT infrastructure, less mature in GMP environments.
Most biotech facilities use Modbus for legacy systems and OPC UA for new installations. The choice depends on your existing BMS platform and IT infrastructure.
Data architecture typically follows this pattern:
The power of continuous monitoring lies in intelligent alerting. You don’t want alerts for every minor fluctuation; you want alerts that indicate actual problems requiring investigation.
Alert thresholds should be set at 70-80% of specification limits, not at the specification limit itself. This gives you time to investigate and correct before you actually fail.
Example alert thresholds for a typical ISO Class 5 facility:
| Parameter | Specification | Alert Threshold | Alert Type |
|---|---|---|---|
| Pressure Differential (Critical vs. Buffer) | +0.02 to +0.05 in H₂O | <+0.015 in H₂O | Immediate alarm |
| Pressure Differential (Critical vs. Buffer) | +0.02 to +0.05 in H₂O | >+0.08 in H₂O | Immediate alarm |
| Pressure Differential Stability | ±0.01 in H₂O variation | >±0.015 in H₂O over 1 hour | Trend alarm |
| Particle Count (Critical Area) | <3,520 particles ≥0.5 μm/m³ | >2,500 particles ≥0.5 μm/m³ | Trend alarm |
| Particle Count (Critical Area) | <3,520 particles ≥0.5 μm/m³ | >3,000 particles ≥0.5 μm/m³ | Immediate alarm |
| Supply Air Temperature | 68-72°F | <66°F or >74°F | Immediate alarm |
| Supply Air Humidity | 35-65% RH | <30% or >70% RH | Immediate alarm |
| Air Velocity (Supply) | 0.3-1.0 m/s | <0.25 m/s or >1.2 m/s | Immediate alarm |
Alarm logic should distinguish between immediate alarms (require immediate response) and trend alarms (indicate developing problems). Immediate alarms trigger notifications to facility staff and may automatically halt production if the parameter is critical. Trend alarms notify staff but don’t necessarily stop production; they indicate that investigation is needed soon.
Example trend logic: If particle counts exceed 2,000 particles ≥0.5 μm/m³ for more than 30 minutes, send a trend alarm. If counts exceed 3,000 for more than 15 minutes, send an immediate alarm.
Continuous monitoring enables operational decisions that manual testing cannot:
Predictive maintenance: When you see a trend (pressure differential slowly declining, particle counts gradually increasing, velocity dropping), you can schedule maintenance before failure occurs. Instead of discovering a failing HEPA filter during annual certification, you see the filter degrading over weeks and schedule replacement during a planned maintenance window.
Process optimization: Real-time data reveals how specific activities affect airflow. You might discover that a particular equipment operation generates a spike in particle counts, or that opening a specific door causes a temporary pressure drop. Armed with this knowledge, you can adjust procedures to minimize impact.
Energy optimization: Continuous data allows you to optimize air change rates and fan speeds. Many facilities discover they can reduce fan speed during low-activity periods without compromising contamination control, reducing energy consumption by 10-20%.
Rapid problem diagnosis: When a contamination incident occurs, you have detailed historical data showing exactly what happened in the hours before the incident. Was pressure differential low? Did particle counts spike? Did temperature fluctuate? This data accelerates root cause analysis.
Regulatory confidence: When regulators inspect your facility, you can show continuous compliance data spanning months or years. This demonstrates that contamination control isn’t a one-time achievement but an ongoing operational priority.
Implementing BMS integration typically follows this timeline:
Phase 1 (Months 1-2): Planning and design
Phase 2 (Months 2-4): Installation and integration
Phase 3 (Months 4-6): Validation and optimization
Total implementation cost: $45,000-115,000 depending on facility size and complexity.
Ongoing annual costs: $15,000-25,000 for sensor maintenance, calibration, software licenses, and data analysis.
For facilities manufacturing high-value products, the ROI is typically 12-24 months. The cost of a single contamination incident (product loss, investigation, remediation, regulatory response) often exceeds the annual cost of continuous monitoring.
Once you have months of continuous data, you can apply analytics to predict problems before they occur.
Trend analysis: Plot metrics over time and fit trend lines. If pressure differential is declining at a rate of 0.001 inches per week, you can predict when it will reach your alert threshold and schedule maintenance accordingly.
Correlation analysis: Identify relationships between metrics. You might discover that particle counts spike 30 minutes after a specific equipment operation, or that humidity above 60% correlates with higher contamination rates. These correlations guide process optimization.
Anomaly detection: Machine learning algorithms can identify unusual patterns in your data. If pressure differential suddenly drops by 0.02 inches (a change that normally takes weeks), the algorithm flags it as an anomaly requiring immediate investigation.
Seasonal pattern recognition: Some facilities see seasonal variations in airflow performance due to outdoor temperature changes or humidity variations. Historical data reveals these patterns, allowing you to adjust setpoints seasonally.
Many BMS platforms now include built-in analytics, or you can integrate with third-party analytics platforms (Tableau, Power BI, or Python-based tools) for more sophisticated analysis.
The most advanced facilities integrate their BMS data with computational fluid dynamics (CFD) models (digital twins). The digital twin is continuously updated with real sensor data, allowing it to predict airflow behavior under different conditions and identify optimization opportunities.
For example, if your digital twin predicts that reducing supply fan speed by 10% would maintain ISO Class 5 performance while reducing energy consumption, you can test this prediction using real data. If the prediction is accurate, you implement the change permanently. If not, you adjust the model and try again.
This feedback loop between real data and simulation creates a continuously improving system. Over time, your facility becomes more efficient and more reliable.
Digital twin integration requires investment in CFD software ($30,000-100,000 for initial modeling) and ongoing expertise, but for large facilities with complex airflow challenges, the investment pays off through optimized operations and reduced troubleshooting time.
When advanced airflow testing for biotech reveals failures, you need a systematic approach to diagnosis and remediation. The most common failures have known causes, known fixes, and measurable indicators that tell you which fix to apply. This section provides the decision tree most competitors skip: how to move from "test failed" to "problem solved" with confidence.
Particle count failures are the most common finding during routine monitoring. A room that passed last quarter now shows particle counts above ISO Class 5 limits (>3,520 particles ≥0.5 μm/m³ during dynamic operations). The question is: what changed?
Step 1: Verify measurement validity (15 minutes)
Before assuming the room failed, confirm your particle counter is functioning correctly. Check:
If the counter itself is suspect, recalibrate or use a backup counter at the same location. If readings remain high with a different counter, the room actually failed.
Step 2: Identify the failure location (30 minutes)
Particle counts vary across the room. High readings in one location but not others point to a localized problem. Take measurements at a grid of points across the critical work surface (at least 9 locations for a typical ISO Class 5 area). Plot the results on a room diagram.
If high counts cluster in one corner or behind equipment, you have a dead zone or airflow obstruction. If high counts are scattered randomly, you have a uniformity problem. If high counts are consistently high everywhere, you have a systemic issue (HEPA filter degradation, inadequate air change rate, or supply air contamination).
Step 3: Correlate with smoke study observations (1 hour)
Conduct a smoke study at the same time you’re taking particle counts. Observe whether smoke moves smoothly through the high-count areas or whether it stalls, swirls, or reverses direction. Smoke behavior and particle count location together tell you the root cause:
Step 4: Measure velocity and pressure differential (1 hour)
Use a calibrated anemometer to measure air velocity at the locations where particle counts are high. Velocity should be 0.3-1.0 m/s for unidirectional flow. If velocity is below 0.3 m/s, airflow is too slow to sweep particles away. If velocity is above 1.0 m/s, you may have turbulence.
Also check pressure differential across room boundaries. If pressure has dropped below +0.02 inches of water column, you may have an air leak that’s allowing unfiltered air to enter the room. A sudden pressure drop often precedes particle count excursions.
Step 5: Execute targeted remediation (2-24 hours depending on fix)
Based on your diagnostic findings, apply the appropriate fix:
If dead zone identified:
If turbulent airflow identified:
If HEPA filter degradation suspected:
If pressure differential low:
If activity-related contamination identified:
Step 6: Verify remediation and document (1 hour)
After implementing a fix, conduct a follow-up particle count at the same locations where you found high counts. Counts should return to baseline (typically <1,000 particles ≥0.5 μm/m³ for ISO Class 5 during normal operations). If counts don’t improve, the diagnosis was incorrect; return to Step 2 and investigate further.
Document the entire troubleshooting process: initial failure, diagnostic steps taken, findings, remediation applied, and verification results. This documentation becomes part of your cleanroom history and helps you recognize patterns if similar failures occur.
Turbulent airflow shows up in smoke studies as swirling or chaotic movement instead of smooth directional flow. It also appears in particle count data as high variability between locations, one spot has excellent particle counts, another spot nearby is terrible.
The root causes are usually:
Improper supply geometry: If supply air enters from a single location or at an angle instead of across the entire ceiling, it can’t create uniform flow. The fix is often repositioning supply diffusers or adding baffles to distribute flow more evenly. Measure velocity across the work surface; if velocity varies by more than ±20%, supply geometry is the problem.
Obstructed return air: If return air grilles are blocked by equipment or materials, air can’t exit efficiently. This creates back-pressure that disrupts the intended flow pattern. Check that all return air grilles are clear and unobstructed. Smoke should move smoothly toward return grilles without stalling.
Equipment placement: Large pieces of equipment in the middle of the room act as obstacles that disrupt airflow. Sometimes repositioning equipment (moving it to the room perimeter instead of center) solves the problem. Other times you need to add baffles around equipment to guide airflow. Conduct a smoke study before and after repositioning to verify improvement.
Inadequate velocity: If air velocity is too low, natural air currents and thermal effects can overpower the intended flow direction. Increasing fan speed (if possible) or reducing room volume through better layout can increase velocity and restore laminar flow. Target velocity should be 0.45-0.6 m/s for optimal balance between contamination control and energy efficiency.
Dead zones appear in smoke studies as areas where smoke stalls or moves very slowly, and in particle counts as consistently high readings in specific locations (usually corners or behind equipment).
Behind equipment: The most common dead zone location. Smoke can’t reach behind a piece of equipment if the equipment is flush against a wall or other obstacle. The fix is either repositioning the equipment or installing a return air grille directly behind it to pull air through. After repositioning, smoke should move smoothly through the previously dead zone.
Below work surfaces: If return air is only at the ceiling level, air below work surfaces (where product is actually exposed) can stagnate. Installing return air grilles at mid-wall height or adding local exhaust near work surfaces can eliminate this problem. Verify with a smoke study that air now flows from supply to return through the work surface area.
Corners and edges: Rooms with sharp 90-degree corners often develop dead zones in those corners. Rounded corners or baffles that guide airflow through corners can help. A simple test: place a smoke source in the corner and observe whether smoke is pulled toward return air or stalls. If it stalls, install a baffle.
Pressure differential failures fall into two categories: insufficient positive pressure (room pressure is too low relative to adjacent spaces) or inconsistent pressure (pressure drifts or fluctuates). Both require different diagnostic approaches.
Insufficient positive pressure (pressure below +0.02 inches of water column) usually means:
Inconsistent pressure (pressure that fluctuates or drifts over hours or days) indicates:
Verification: After addressing pressure differential issues, monitor pressure continuously for 24 hours. It should remain within ±0.01 inches of water column of your target setpoint. If pressure still fluctuates, the root cause hasn’t been found; investigate further.
The best facilities have a written protocol for responding to test failures. The protocol specifies:
Without a protocol, failures create confusion and delays. With a protocol, failures become routine problems with known solutions.
The question most facility managers ask: is advanced airflow testing for biotech worth the investment? The answer depends on your risk tolerance and product value.
Traditional approach: Conduct basic airflow testing annually, rely on routine particle counting and microbial monitoring, investigate problems after they occur.
Advanced approach: Implement continuous monitoring with BMS integration, conduct quarterly smoke studies and velocity measurements, use predictive analytics to catch problems before they impact production.
The traditional approach costs less upfront, maybe $5,000-10,000 per year for annual certification testing. But the hidden costs are substantial. A contaminated batch that must be destroyed costs tens of thousands of dollars. An unplanned facility shutdown for remediation costs hundreds of thousands in lost production. A regulatory warning letter can shut down your entire operation pending corrective action.
The advanced approach costs more upfront, $50,000-150,000 to install permanent monitoring infrastructure and integrate with BMS, plus $15,000-25,000 annually for monitoring and analysis. But the return on investment is clear: fewer contamination incidents, faster product launches (because validation is already built into operations), and regulatory confidence (because your data demonstrates continuous compliance).
For facilities manufacturing high-value products (biologics, sterile injectables), the break-even point is usually 6-12 months. The cost of a single contamination incident exceeds the annual cost of advanced monitoring. For lower-value products, the payback period might be 2-3 years.
The real value of advanced airflow testing for biotech isn’t just contamination prevention. It’s operational stability. Facilities with strong monitoring programs experience fewer surprises, faster problem resolution, and more consistent batch quality. That consistency is what customers pay for.
The newest frontier in advanced airflow testing for biotech is computational fluid dynamics (CFD) modeling, creating a digital twin of your cleanroom that simulates airflow behavior under different conditions.
A digital twin is built from your facility’s actual design specifications, equipment locations, and operational parameters. CFD software then models how air moves through the space, where dead zones form, how pressure differentials behave. The digital twin can be tested under different scenarios: what happens if a supply damper fails? What’s the impact of adding new equipment? How does airflow change with seasonal temperature variations?
The advantage is that you can identify problems virtually before they occur in the real facility. You can optimize equipment placement, supply geometry, and air change rates without expensive physical modifications. You can train personnel on what to expect during actual operations.
Some facilities have integrated their digital twins with real-time BMS data. The model updates continuously with actual sensor readings, allowing it to predict when components will fail or when particle counts will exceed limits. This enables truly predictive maintenance, replace a HEPA filter before it actually leaks, adjust dampers before pressure differential drifts out of spec.
Digital twin implementation requires investment in CFD software and expertise, typically $30,000-100,000 for initial modeling plus ongoing maintenance. But for large facilities with complex airflow challenges, the investment pays off through optimized operations and reduced troubleshooting time.
USP <797> sets the standard for compounding pharmacies in the United States. It mandates specific airflow requirements for aseptic processing areas, and those requirements drive the need for advanced airflow testing for biotech.
USP <797> requires:
The standard is prescriptive, it tells you exactly what to test and how often. But it’s also outcome-focused, if your cleanroom maintains ISO Class 5 during operations, you’re compliant regardless of how you achieve it.
Many compounding pharmacies struggle with USP <797> compliance because they underestimate the complexity of maintaining true ISO Class 5 performance during actual operations. They pass static testing but fail dynamic testing. They achieve ISO Class 5 when the room is empty but degrade to ISO Class 6 or worse once personnel enter and equipment runs.
This is where advanced airflow testing for biotech becomes essential. You need to understand exactly how your operations affect airflow, and optimize your facility design and procedures to maintain compliance during actual compounding.
The regulatory expectation is clear: you must validate your cleanroom, document the validation thoroughly, and maintain compliance through ongoing monitoring. Regulators expect to see evidence of continuous commitment to environmental control, not just annual testing that happens to pass.
Building a strong advanced airflow testing for biotech program requires commitment to precision, documentation, and continuous improvement. The facilities that maintain zero contamination incidents aren’t the ones with the newest equipment, they’re the ones that treat airflow testing as an ongoing operational priority, not a compliance checkbox.
Applied Physics has supported cleanroom operations since 1992 with precision equipment designed specifically for GMP environments. Our FFU (Fan Filter Unit) systems provide reliable HEPA filtration with energy-efficient microprocessor controls, while our air sampling equipment delivers the precision required for USP <797> and ISO 14644 validation. Whether you’re commissioning a new facility or optimizing an existing one, we help you achieve the airflow performance your products demand. Contact Applied Physics today to discuss how advanced airflow testing can transform your manufacturing reliability.
Biotech cleanrooms must comply with USP <797> for aseptic processing and ISO 14644 standards for classification and control. These regulations mandate unidirectional airflow, pressure differentials, air change rates (typically 20-40 per hour for ISO 5 areas), and routine certification intervals. Smoke studies and velocity measurements are required to validate airflow uniformity and identify contamination risks. Documentation of all testing results is essential for GMP compliance and regulatory audits.
Initial performance qualification (PQ) testing is required before operational use. Routine certification intervals typically range from annually to every three years, depending on facility classification and regulatory requirements. High-risk areas like ISO 5 critical processing zones may require more frequent testing. After any HVAC modifications, filter replacements, or facility changes, re-validation testing is mandatory. Many facilities adopt semi-annual or quarterly monitoring using continuous BMS integration for real-time airflow data.
Smoke studies use tracer aerosols to visualize airflow patterns and reveal undesirable flow characteristics such as dead zones, turbulence, and bypass paths. This airflow visualization technique is critical for GMP compliance because it demonstrates that unidirectional airflow is maintained and contamination is effectively controlled. Smoke studies validate design specifications, identify pressure differential issues, and confirm that critical processing areas receive adequate protection. Results are documented as part of dynamic testing during performance qualification and routine certification.
HEPA filter integrity testing, including DOP (dioctyl phthalate) testing and leak detection, ensures filters remove particles and microorganisms effectively. Compromised filters allow contamination to bypass filtration, directly risking product quality and regulatory compliance. Testing validates that filters meet design specifications for particle removal efficiency. Regular HEPA filter integrity checks as part of advanced airflow testing programs confirm that cleanroom environmental monitoring results are reliable and that aseptic processing areas maintain the required ISO classifications and protection levels.
Essential tools include particle counters (such as the Aerosol Photometer BAP-350) for HEPA validation, microbial air samplers (like the P100ss or BK-BAS2) for contamination assessment, velocity measurement devices for airflow uniformity confirmation, and smoke generators for visualization. Many facilities integrate these tools with Building Management Systems for continuous monitoring. Additional equipment includes pressure differential gauges, data logging devices, and calibration standards. Proper equipment selection depends on your facility's ISO classification and regulatory requirements.
Yes, advanced airflow testing is scalable to smaller operations and confined spaces like glove boxes. Portable microbial air samplers (such as the P100ss) are designed for ISO 5 and ISO 7 zones and can be used in compact environments. Smoke studies can be adapted for smaller areas by using lower-volume foggers and adjusting visualization techniques. However, confined spaces may present challenges for comprehensive velocity mapping and require specialized protocols. Consulting with validation experts ensures your testing program is appropriate for your facility's size and configuration while maintaining regulatory compliance.
BMS integration enables continuous, real-time monitoring of critical airflow parameters such as pressure differentials, air change rates, and HEPA filter status. This replaces periodic manual testing with automated alerts for deviations, reducing contamination risk and downtime. BMS integration supports predictive maintenance by identifying filter degradation trends before failures occur. Data logging through BMS provides comprehensive audit trails for regulatory compliance and enables digital twin simulation for predictive airflow modeling. This proactive approach reduces validation costs and improves operational efficiency compared to traditional interval-based testing alone.
This article was written using GrandRanker

Enter your details below to save your shopping cart for later. And, who knows, maybe we will even send you a sweet discount code :)
Allow notifications to get real-time updates about your shopping cart and who knows, you may even receive a sweet discount code 😊