In the world of semiconductor manufacturing, the difference between a high-yield production run and a total loss is often measured in microns.
As components shrink and complexity grows, the demand for ultra-clean environments becomes absolute.
At the heart of maintaining these environments is ISO 14644-3 compliance, specifically concerning airflow visualization.
Optimizing how you visualize and manage air patterns is not just a regulatory hurdle; it is a critical strategy for protecting your bottom line.
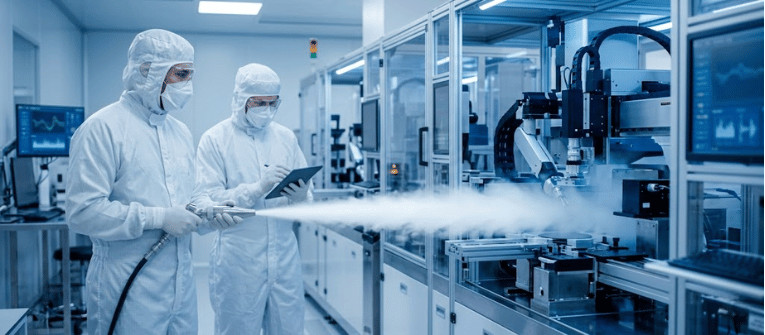
ISO 14644-3 outlines the test methods used to characterize the performance of cleanrooms and associated controlled environments. One of the most vital components of this standard is the Airflow Visualization Test, often referred to as a smoke study.
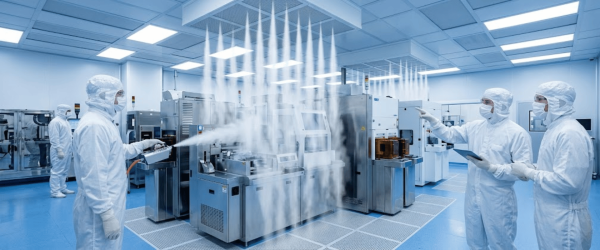
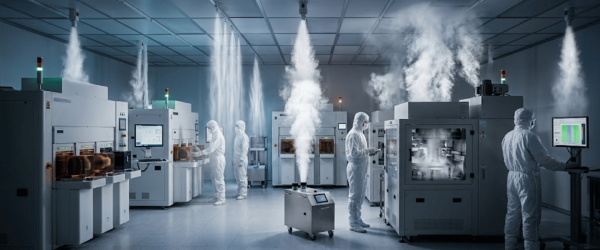
The goal is simple: to provide visual evidence that the air in a cleanroom is moving in the intended direction (unidirectional or non-unidirectional) and to identify areas of turbulence or dead zones where contaminants could linger.
For semiconductor fabs, air is more than just atmosphere; it is a transport mechanism. If airflow is not optimized, the following risks emerge.
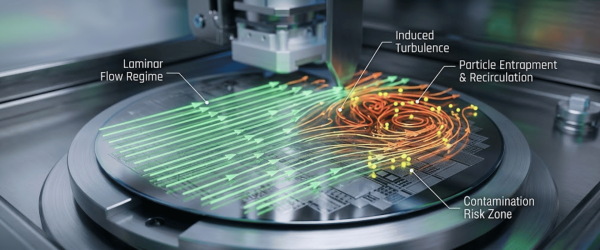
By utilizing advanced airflow visualization, engineers can see these invisible threats and adjust HVAC systems, tool placements, or operator protocols to maximize yield.
To meet ISO 14644-3 standards while maintaining the integrity of a high-purity fab, the choice of equipment is paramount.
Standard foggers often use chemicals or oils that leave residues, which is unacceptable in a semiconductor environment. Optimized visualization requires Ultrapure Foggers (such as the AP and CRF series).
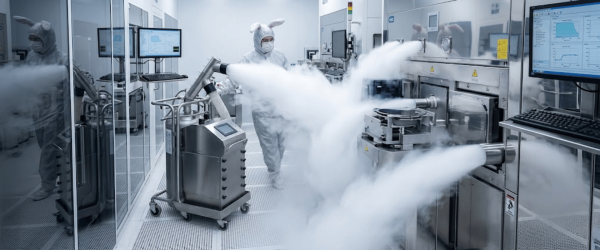
These devices use Deionized (DI) water and liquid nitrogen or high-frequency ultrasonic transducers to create a high-density, zero-residue fog. This dry fog behaves exactly like air, providing a true-to-life representation of patterns without risking the equipment.
Tests should be conducted in two states.
| Technology Type | Media Used | Residue Level | Ideal Cleanroom Class | Primary Application |
|---|---|---|---|---|
| Ultrapure Fogger (AP Series) | LN2 & DI Water | Zero (Ultrapure) | ISO 1 – ISO 5 | High‑yield wafer fabs, 5nm / 7nm processes |
| DI Water Fogger (CRF Series) | Deionized Water | Minimal to None | ISO 5 – ISO 9 | Tool validation, pharma labs, hospital suites |
| CO₂ / Dry Ice Fogger | CO₂ & Water | Medium (CO₂ Gas) | Non‑Classified | General HVAC testing, industrial airflow |
| Smoke Sticks / Chemicals | Glycol / Chemical | High (Dangerous) | Not Recommended | General warehouses, leak detection (Non‑Fab) |
Achieving ISO 14644-3 compliance requires precision tools that match the sophistication of the fab itself.
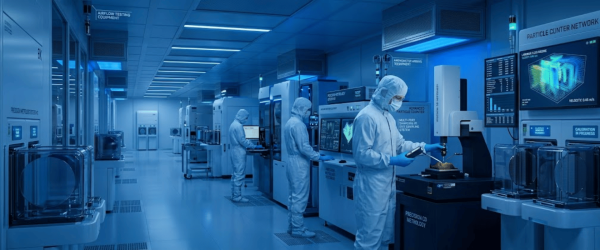
Applied Physics USA provides the metrology and airflow visualization systems necessary for rigorous validation.
Optimizing airflow visualization is an investment in the reliability of your manufacturing process.
By adhering to ISO 14644-3 through the use of high-purity fogging technology, semiconductor manufacturers can identify turbulence, eliminate stagnant zones, and ensure that their high-yield goals are consistently met.
In a high-stakes industry where every particle counts, seeing the air is the first step toward mastering the environment.
Airflow visualization, or smoke studies, provides visual proof that cleanroom air moves correctly to sweep away particles. For semiconductor fabs, this ensures that turbulence or stagnant zones do not trap contaminants that could damage sensitive silicon wafers and lower production yields.
An ultrapure fogger uses Liquid Nitrogen (LN2) and Deionized (DI) water to create a high-density, zero-residue fog that evaporates completely. Standard foggers or smoke sticks often use chemicals or glycol, which can leave microscopic residues that are catastrophic for high-purity semiconductor environments.
Under ISO 14644-3 guidelines, tests should be performed during the initial cleanroom certification (As-Built), after any major equipment installations or structural changes, and as part of periodic annual or bi-annual compliance audits to ensure ongoing environmental control.
Yes. By visualizing the fog at doorways and pass-throughs, engineers can confirm that air is flowing from high-pressure (cleaner) areas to lower-pressure areas. This visual pressure check prevents cross-contamination from entering the most critical zones of the fab.