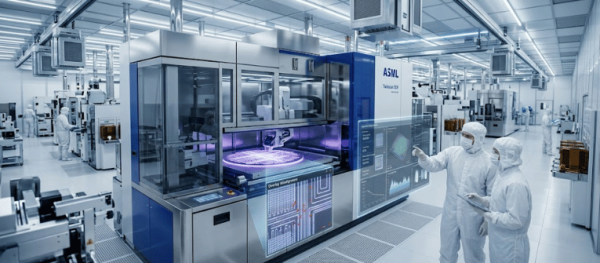

In the world of high-precision manufacturing spanning semiconductors, pharmaceuticals, and aerospace, the smallest invisible threat can lead to the greatest financial losses.
While cleanrooms are designed to filter out airborne contaminants, a busy cleanroom introduces a dynamic variable that standard filtration often fails to capture: particle re-suspension.
This article explores how modeling particle re-suspension can help facility managers and quality control engineers identify contamination hotspots, optimize airflow, and significantly reduce product defect rates.
In a static environment, particles follow predictable gravitational settling patterns. However, in a busy cleanroom, the energy introduced by human activity and machinery can overcome the adhesive forces (Van der Waals forces) holding a particle to a surface.
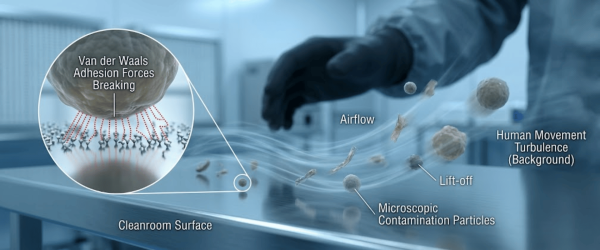
Once re-suspended, these particles can migrate into critical clean zones or directly onto sensitive products, causing micro-scratches on silicon wafers or biological contamination in sterile drug batches.
A cleanroom’s ISO classification is often measured in an at-rest state. However, the operational state is where most contamination-related defects occur.
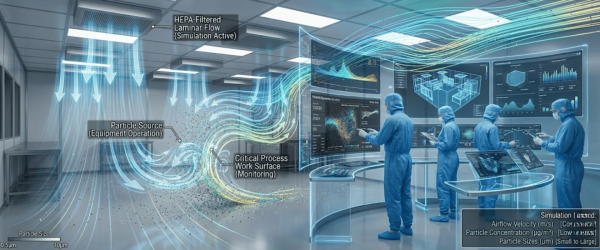
Humans are the primary source of particles in a cleanroom. Beyond shedding skin cells, the physical act of walking creates wakes of turbulence.
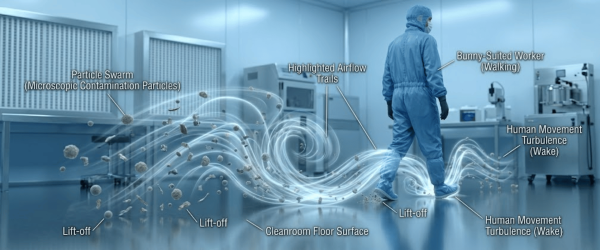
This turbulence acts like a vacuum, pulling settled particles off the floor and into the breathing zone and work surfaces.
When a cleanroom is busy, the frequency of movement increases. Modeling shows that a single person walking at a moderate pace can resuspend thousands of particles per minute.
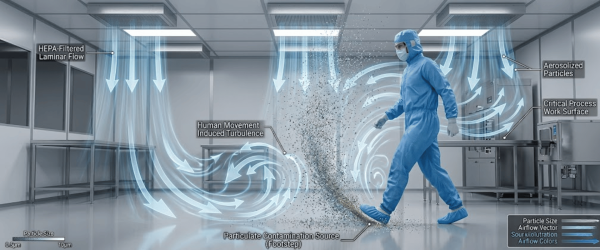
If the airflow velocity is not optimized to sweep these particles toward the return air vents immediately, they remain buoyant long enough to settle on the product.
To reduce defects, manufacturers are moving away from reactive cleaning and toward predictive modeling.
By using Computational Fluid Dynamics (CFD) and Airflow Visualization, facilities can create a digital twin of their cleanroom.
CFD modeling allows engineers to simulate various busy scenarios.
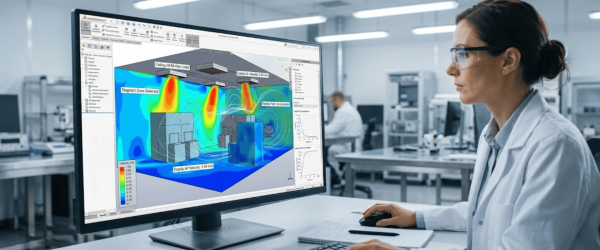
By inputting variables such as the number of operators, the speed of conveyor belts, and the heat output of machinery, the model can predict.
While CFD provides the math, airflow visualization provides the proof. Using ultrapure foggers to conduct smoke studies allows teams to see how re-suspended particles behave physically.
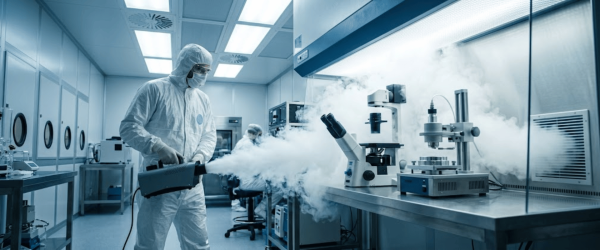
If a fogger shows air swirling around a technician’s feet and then rising toward the workbench, it indicates a high risk of re-suspension-induced defects.
Once modeling has identified the risks, several strategies can be implemented to mitigate the busy cleanroom effect.
Reducing defects in a busy cleanroom requires looking beyond the HEPA filters.
By understanding and modeling the physics of particle re-suspension, facilities can transition from general cleanliness to precision contamination control.
Implementing these models not only protects the integrity of the product but also ensures compliance with ISO 14644 standards and improves overall manufacturing yield.
For industries where a single micron-sized particle can lead to a million-dollar failure, modeling re-suspension is no longer optional; it is a competitive necessity.
Particle re-suspension occurs when contaminants that have already settled on surfaces, such as floors or equipment, are pushed back into the air. This is usually caused by physical movement, door swings, or air turbulence, allowing particles to land on sensitive products and cause defects.
In a busy cleanroom, constant personnel movement and machinery operation create unpredictable air currents. These wakes of turbulence act as energy sources that lift settled dust and fibers back into the breathing zone, making it much harder for standard HEPA filtration to keep the area sterile.
Yes. By using Computational Fluid Dynamics (CFD) or airflow visualization, engineers can identify dead zones where re-suspended particles tend to linger. By optimizing airflow based on these models, you can ensure that particles are swept into return vents immediately rather than settling on critical components.