
In the high-stakes environments of pharmaceutical compounding, semiconductor fabrication, and biotechnology, the mantra is control what you can measure.
Historically, contamination control has relied on two distinct pillars: Airflow Visualization (Smoke Studies) to see where air goes, and Microbial Monitoring to identify what is in that air.
However, as we move into 2026, the industry is shifting toward a unified approach.
Integrating these two practices doesn’t just add a layer of safety; it creates a proactive, data-driven shield against catastrophic contamination events.
For decades, cleanroom managers have treated airflow and microbiology as separate disciplines. Airflow visualization using high-purity foggers is typically performed during at-rest or operational qualification to ensure laminar flow and identify turbulence.
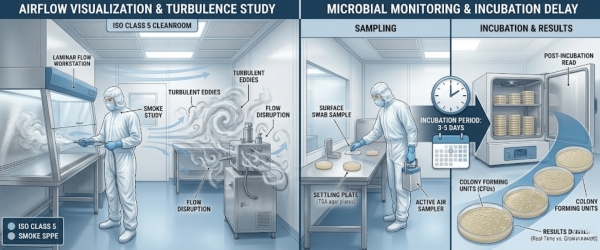
Conversely, microbial monitoring has often been retrospective, relying on agar plates and 5–7 days of incubation. The gap between these two methods creates a blind spot. If a smoke study identifies a vortex near a critical work surface, you know the air is turbulent. Still, you don’t know if that turbulence is actively carrying viable biological particles until a week later.
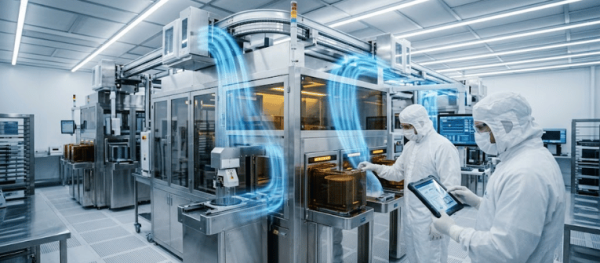
Integrating real-time microbial monitoring with traditional airflow visualization allows facilities to map biological risks directly onto physical air patterns.
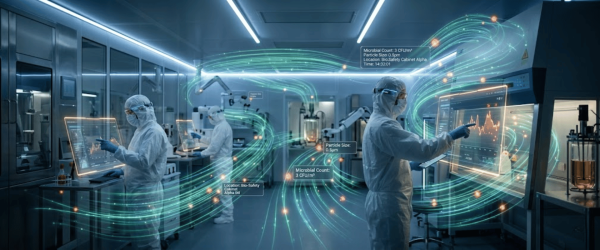
By using Bio-Fluorescent Particle Counters (BFPC) alongside high-output cleanroom foggers, technicians can observe real-time spikes in biological activity exactly when and where airflow disruptions occur.
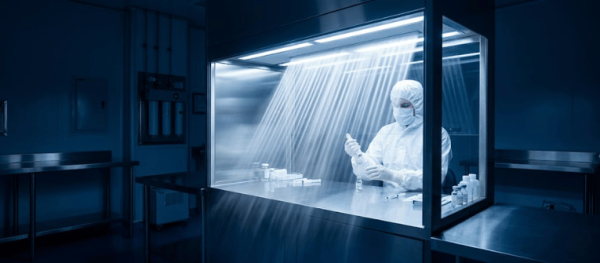
Standard smoke studies using ultrasonic or LN2 foggers are excellent for identifying dead zones or reflux. When integrated with real-time monitors, these studies evolve.
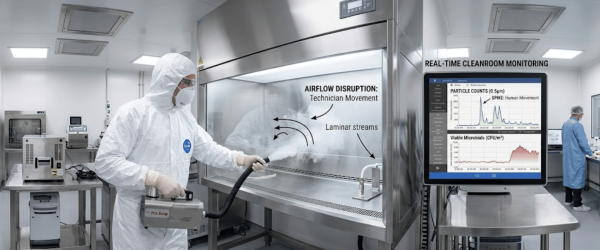
For instance, during a manual intervention in a laminar flow hood, a fogger can visualize the disruption caused by a technician’s arm. At the same time, the microbial monitor provides immediate feedback on whether that disruption introduced viable contaminants.
When a microbial excursion occurs, the why is often hard to pinpoint. By referencing recorded airflow visualization data, quality teams can determine if the excursion was a result.
| Feature | Traditional Siloed Approach | Integrated Monitoring & Visualization |
|---|---|---|
| Detection Speed | Delayed: 5–7 days required for microbial incubation | Instant: Real-time biological particle detection |
| Airflow Insight | Visual Only: Shows where air moves, but not what it carries | Data-Backed: Maps specific microbial spikes to airflow turbulence |
| Root Cause Analysis | Speculative: Difficult to prove why contamination occurred | Definitive: Precisely records which airflow disruption caused the leak |
| Regulatory Standing | Meets basic ISO 14644‑3 requirements | Aligns with Annex 1 and CCS (Continuous Control Strategy) |
| Risk Management | Reactive: Batches may be lost before results arrive | Proactive: Immediate intervention during a live breach |
| Cost Impact | Higher risk of product recalls and discarded batches | Optimized operational uptime and reduced waste |
Regulatory bodies are increasingly looking for Continuous Contamination Control Strategies (CCS).
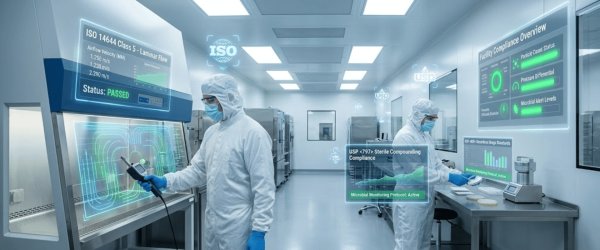
The Annex 1 revision and USP guidelines emphasize the need for a deep understanding of cleanroom dynamics.
To successfully integrate these technologies, facilities should follow a structured implementation path.
The integration of real-time microbial monitoring with traditional airflow visualization represents the pinnacle of cleanroom safety in 2026.
By removing the lag time of traditional sampling and the guesswork of visual-only inspections, facilities can achieve a state of Live Validation.
This synergy not only protects the product and the patient but also provides manufacturers with the ultimate defense in the event of a regulatory audit: a comprehensive, visual, and data-backed map of their sterile environment.
By combining these technologies, facilities can see exactly how airflow turbulence physically transports biological particles in real-time. This eliminates the blind spot of waiting days for lab results, allowing for immediate corrective action during a contamination event.
Yes. Modern regulatory bodies like the FDA and EMA now prioritize a proactive Contamination Control Strategy (CCS). Pairing cleanroom foggers with real-time counters provides the evidence-based documentation required for high-level compliance in sterile environments.
Absolutely. Identifying a breach in real-time allows you to stop production and fix the issue before an entire batch is contaminated. This prevents expensive product recalls and reduces the downtime typically associated with retrospective root-cause analysis.